
Bitcoin chatter is rising again. With new ETFs coming to market, crypto investors are getting very bullish.
Is this a good thing? Or is too much bullishness about to send Bitcoin spiraling?
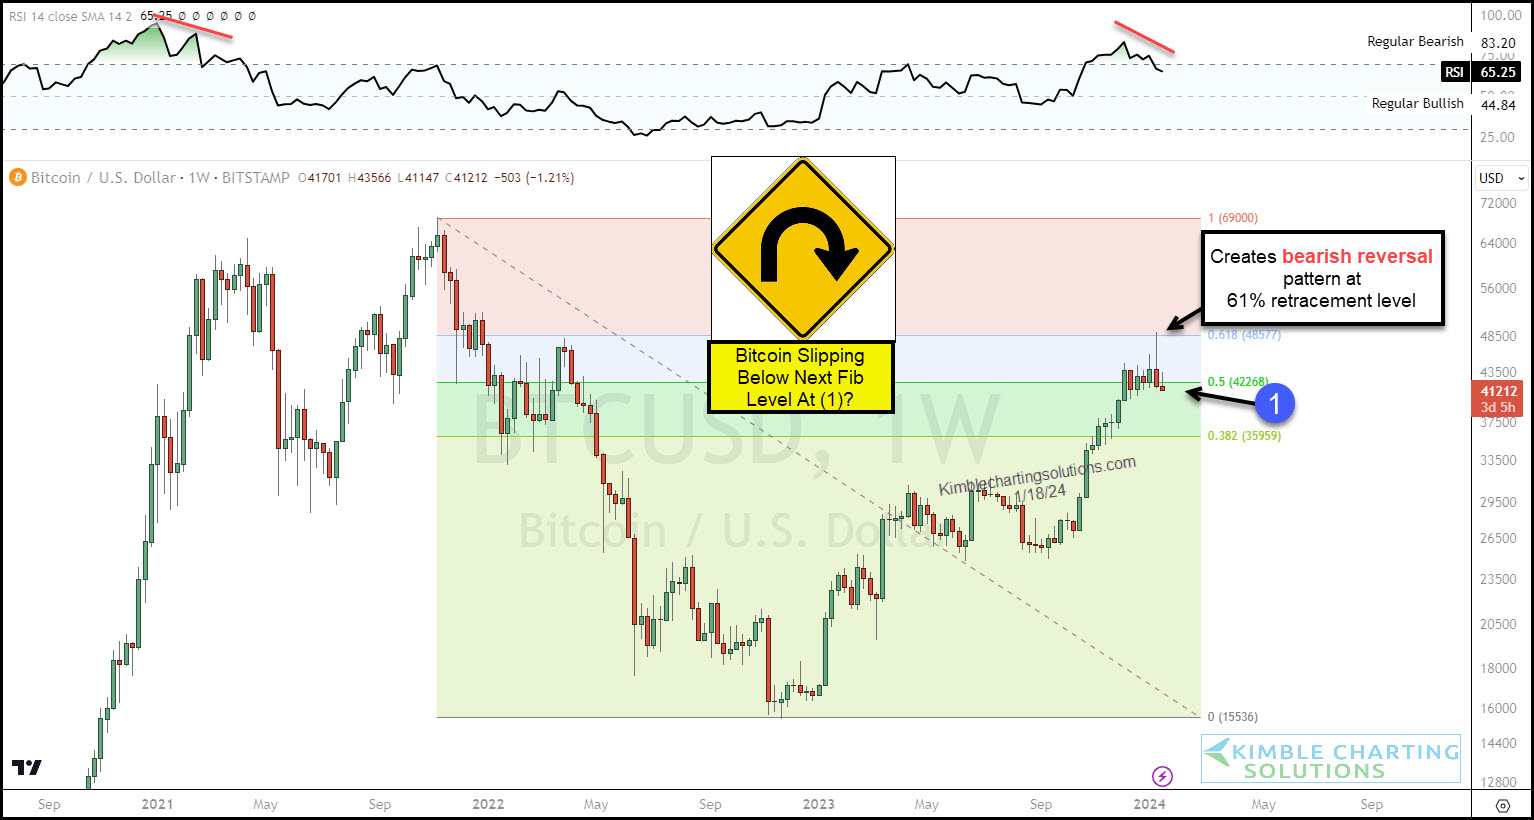
Today we look at a long-term “weekly” chart with Fibonacci levels to show why bears may be circling Bitcoin right now.
Last week, Bitcoin created a bearish reversal at its 61% Fibonacci retracement level. And continued weakness is taking place this week… there’s a potential that Bitcoin will break below its 50% Fib level at (1).
It’s also worth noting the RSI divergence in the top pane.
Looks like Bitcoin may be attempting a trading u-turn of sorts here. Stay tuned!
This article was first written for See It Markets.com. To see the original post, CLICK HERE.
