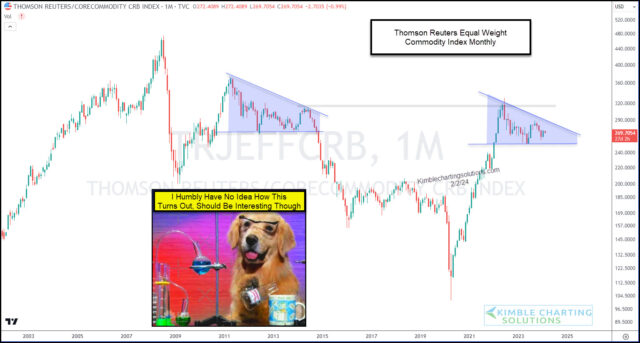
During the COVID pandemic, commodity prices soared. And this lead to a bout of inflation that we hadn’t seen in years.
But commodity prices have leveled off and this has helped to keep inflation in check.
This consolidation like pattern can be see on today’s “monthly” chart of the Thomson Reuters Equal Weight Commodity Index (CRB).
The last time we saw a gigantic wedge pattern, it broke to the downside. But I humbly have no idea which way this pattern will break.
But I do think that when it does make a decisive move out of this pattern, it will be a big deal. So it’s worth keeping on your radar. Stay tuned!
This article was first written for See It Markets.com. To see the original post, CLICK HERE.


