
Bitcoin has been all the rage in the financial markets lately. After it surpassed 50000, headline after headline has come out about it making new all-time highs.
Well it finally happened. And Bitcoin’s price has retreated a little since.
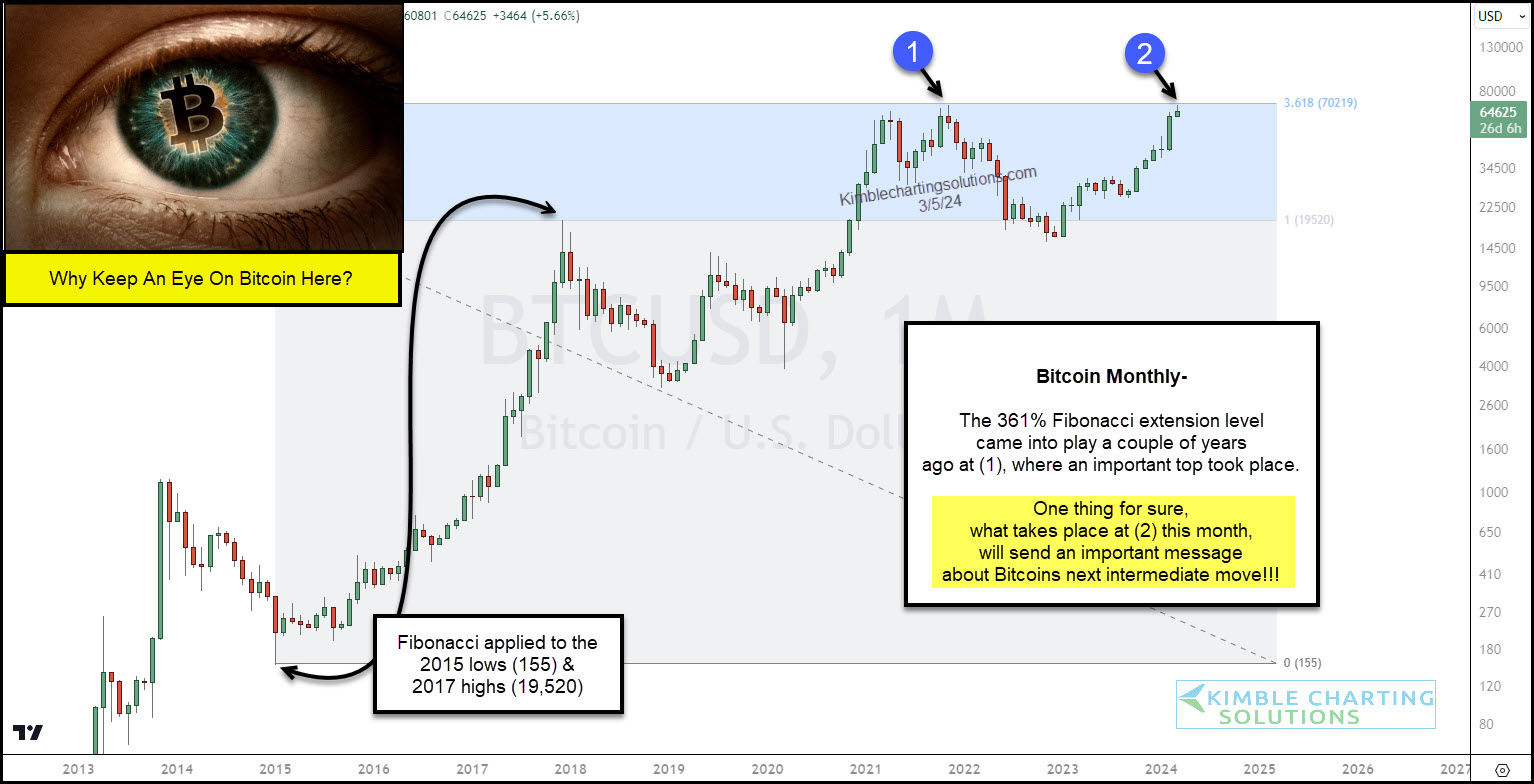
As you can see on today’s “monthly” chart, Bitcoin is basically trading at the highs that formed two years ago – see points (1) and (2). But, more importantly, Bitcoin is trading at its 161% Fibonacci price extension level. This resistance level stopped the last rally at (1)… will it stop (or stall) this rally at (2)?
One thing is for sure: What happens next at (2) is worth keeping a close eye on!!!
This article was first written for See It Markets.com. To see the original post, CLICK HERE.
