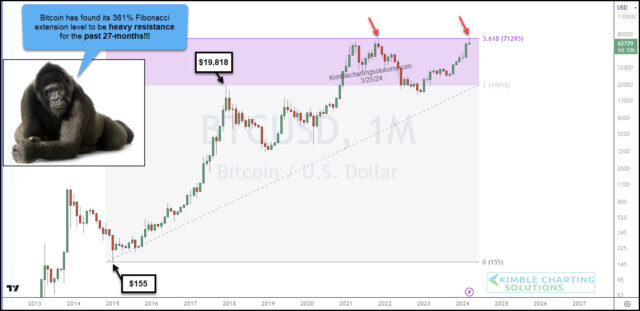
Bitcoin has struggle to overcome a very important price level for more than two years: the 1.618 Fibonacci extension level.
This price area is especially important as it marked Bitcoin’s original all-time high in November 2021. We eclipsed that this month, but price has fallen from those levels.
We can see this in this month’s long wick on the “monthly” chart of Bitcoin below.
If selling continues, we could end the month with a bearish reversal wick (and pattern). That’s a big “if” because there is still a few days to go in the month.
So stay tuned to see how this potential bearish reversal ends the month. It will be interesting!
This article was first published at See It Markets.com. To see the original post, CLICK HERE.


