The U.S. Dollar continues to be the most powerful currency in the world. And for this reason, it’s also the most watched.
When the dollar is on the move, it can have an effect on the various asset classes.
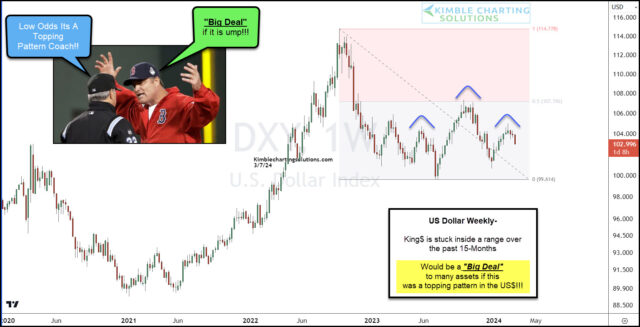
Today we look at a “weekly” chart of the old King Dollar. And as you can see, the dollar has been stuck in a trading range the past 15-months.
During this time, the dollar topped out at the 50% Fibonacci retracement. Looking closer, is it possible that this top is the “head” of a bearish head and shoulders pattern?
Let’s just say that the odds are low that this is a head and shoulders topping pattern.
But it would be a really BIG DEAL if it is. So stay tuned!
This article was first published at See It Markets.com. To see the original post, CLICK HERE.


