CLICK ON CHART TO ENLARGE
Anyone out there old enough to remember the theme song from “Twilight Zone?” (play theme song here)
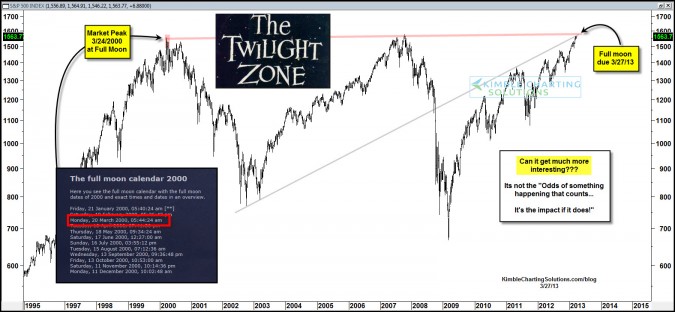
Back in 2000, the high for the S&P 500 took place on March 24th (1,553), near the first day of spring, a couple of days after a full moon. Last week was the first day of spring and a full moon took place, with the S&P 500 up against key resistance in the chart above, reaching 1,570 as a high on March 27th.
We have been living in the Ben/QE zone for many years now. Did a near perfect pattern repeat take place 13 years later last week?
Can Ben stop this pattern from repeating again or are bigger forces at play? ;)
Check out Stocktwits chart here- Stay tuned, this could be fun!!!
–
–


Dear Chris,
Thank you for providing the most precious intelligence which I always treasure.
I am puzzled why SP500 can remain strong enough to keep the present height.
On the weekly chart almost all indicators except MACD show the end of the SP500.
According to the Andrews pitch fork on the daily chart all of the peaks after April 2012 are leaving the center line of the fork (A) and now kissing the underside of the lower resistance line of it.
SP500 is also receiving heavy resistance from the top of another fork (B) and the two forks cross in a few weeks time.
The three points of Andrews pitch fork A & B above are X February 5, Y April 28 and Z July 1st of 2010. The center of Y&Z, May 3rd and October 4th of 2011.
I should be very grateful if you could kindly give your thought regarding the future of SP500.
With the warmest regards,
Mac
It looks to me like it will top out with a dia. tri. 5th wave pattern on Wed. April 3, or very early morning on Thurs. April 4. If this astro event doesn’t turn it down, the next turn is due on April 8th. But the target for SP es is only about 1571 es, (1576-77 spx.), so it shouldn’t take much longer. From that top, we should get a rapid 42 point sell off. Rapid to 1530es.
Don’t want to miss that 40 points down!