
The stock market has been on an incredible run.
As we have pointed out several times, the bull market’s run higher has been led by technology stocks, more precisely, semiconductor stocks.
So, with the stock market indices taking a pause, it makes sense to monitor areas of market leadership. While they can lead us higher, they can also signal concern.
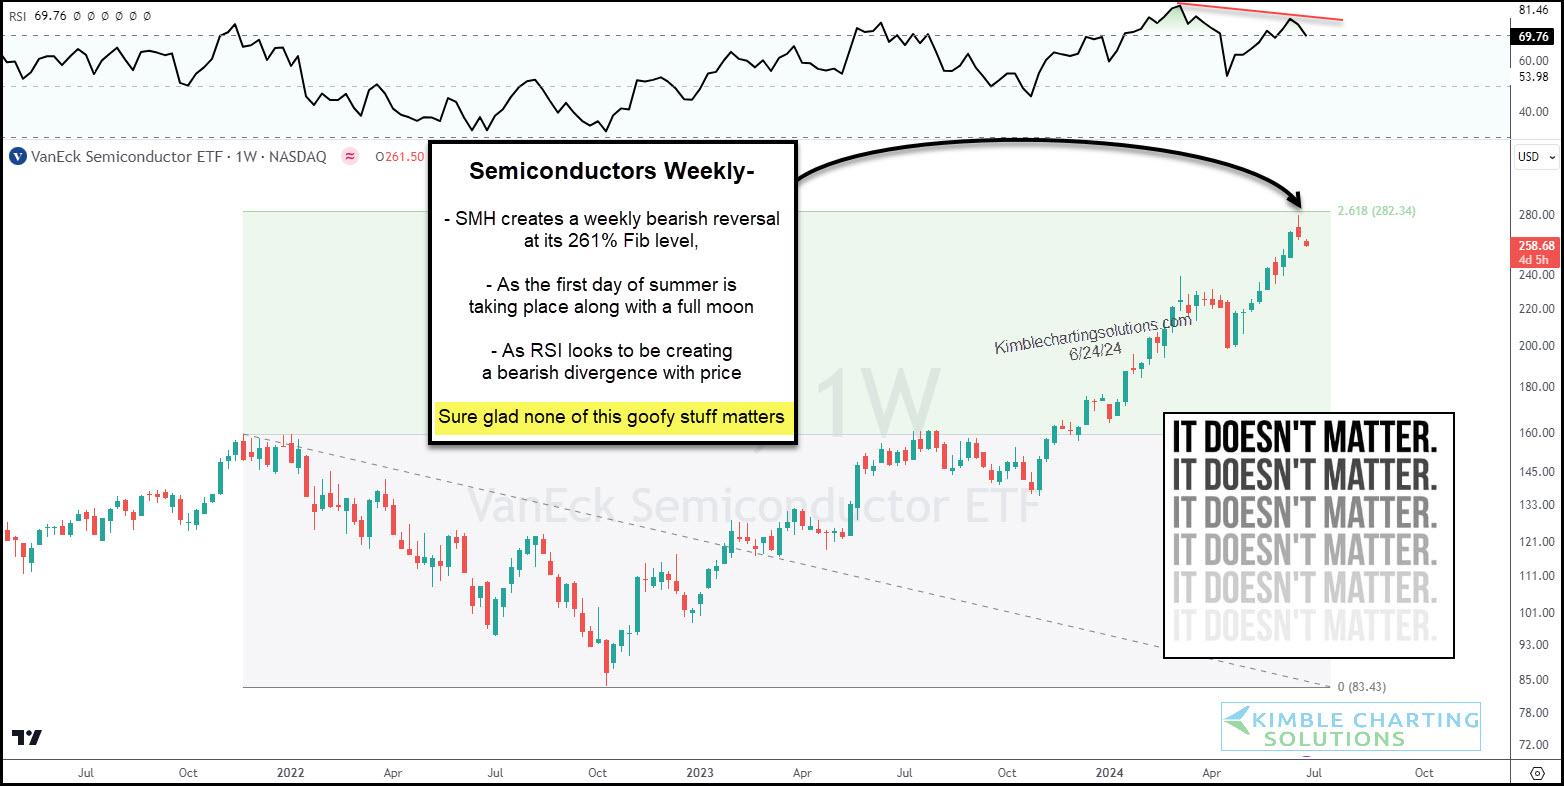
Today we look at a “weekly” chart of the Semiconductors ETF (SMH). Should active investors be concerned here?
SMH created a bearish reversal at its 261% Fibonacci price level… this also occurring over the first day of summer and a full moon! And the Relative Strength Index (RSI) looks to be creating a bearish divergence.
Will any of this goofy stuff matter? It doesn’t matter… until it does. Stay tuned!
This article was first written for See It Markets.com. To see the original post, CLICK HERE.
