
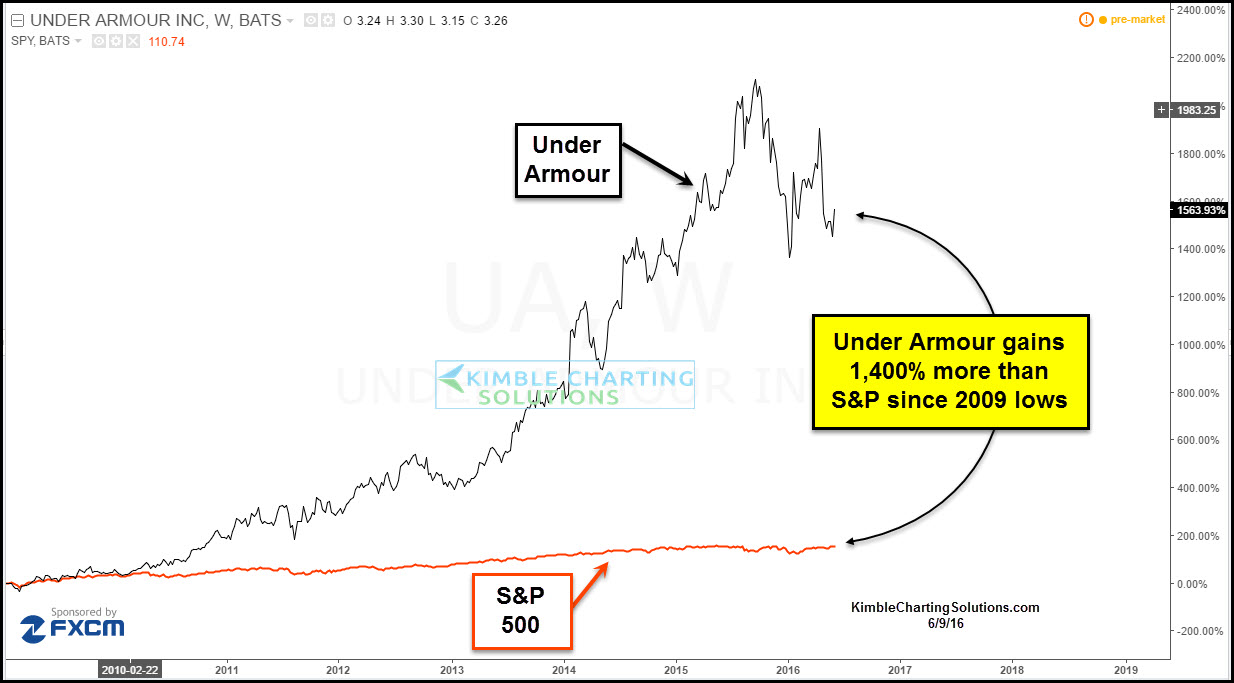
Few stocks have outperformed the S&P 500 by a wider margin than Under Armour since the 2009 lows. Despite the declines of late in UA, it still has outperformed the broad market over 1,000% over the past 6-years.
CLICK ON CHART TO ENLARGE
Below looks at the current chart pattern of UA-
CLICK ON CHART TO ENLARGE
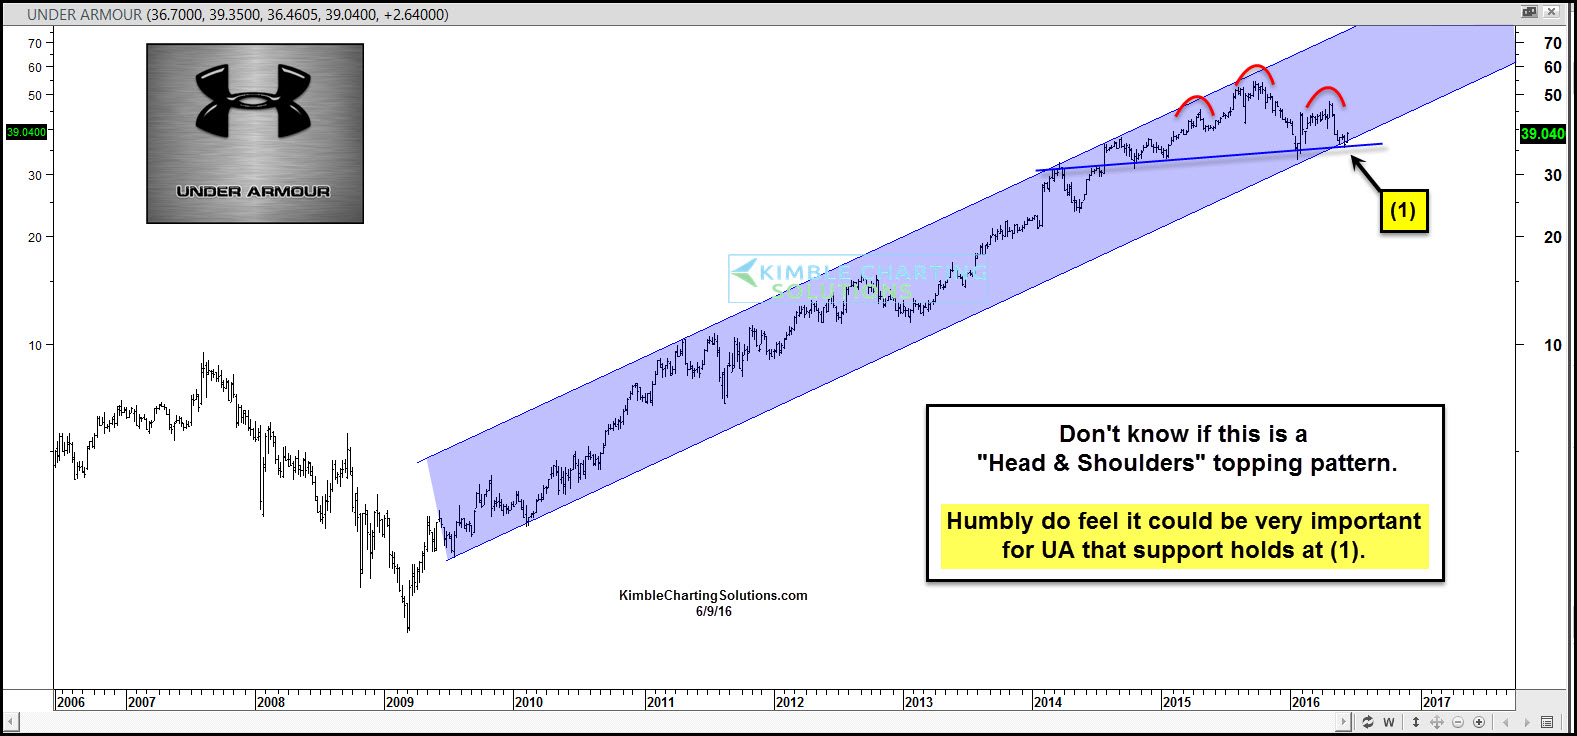
UA remains inside a uniform rising channel since the 2009 lows. As mentioned above, a “Head & Shoulders” topping pattern is NOT proven at this time. UA is testing dual support at (1), that would appear important to hold, for this high flying stock.
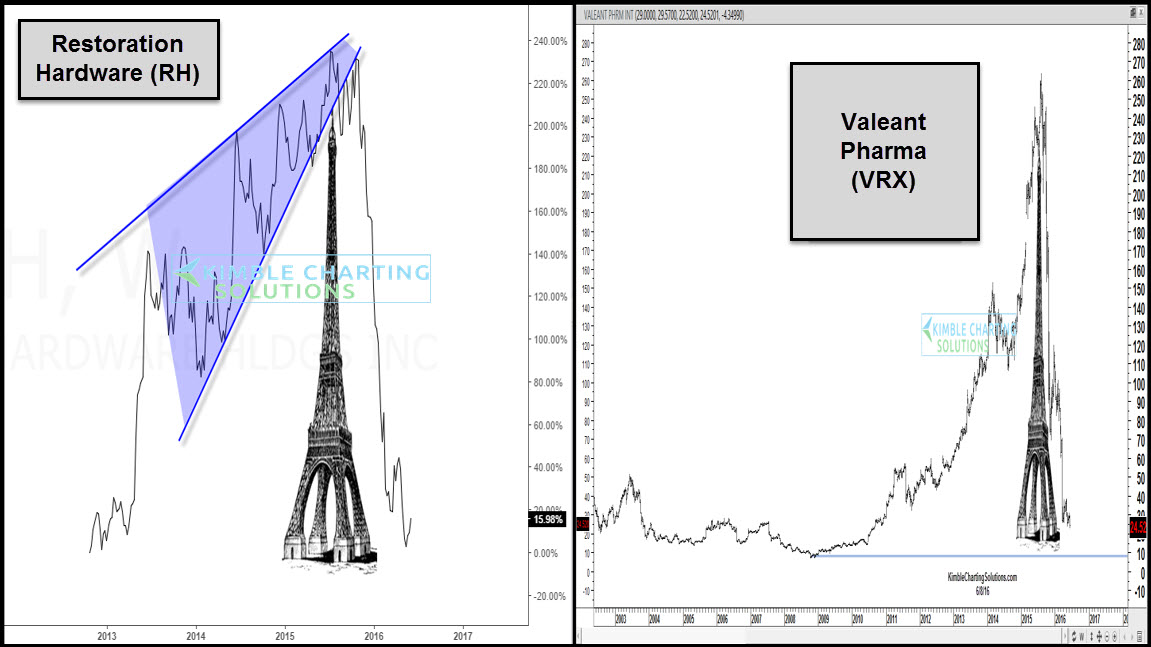
Why is it important for high flying stocks to hold at support? Check out below what happens when a stock creates an Eiffel Tower pattern and support gives way.
CLICK ON CHART TO ENLARGE
Restoration Hardware (RH) and Valeant Pharma (VRX) were high flyers over the past few years. Once support was taken out, sellers came forward.
UA has been an upside leader over the past few years. The Power of the Pattern feels this is NOT your typical support test for UA.
–
