
CLICK ON CHART TO ENLARGE
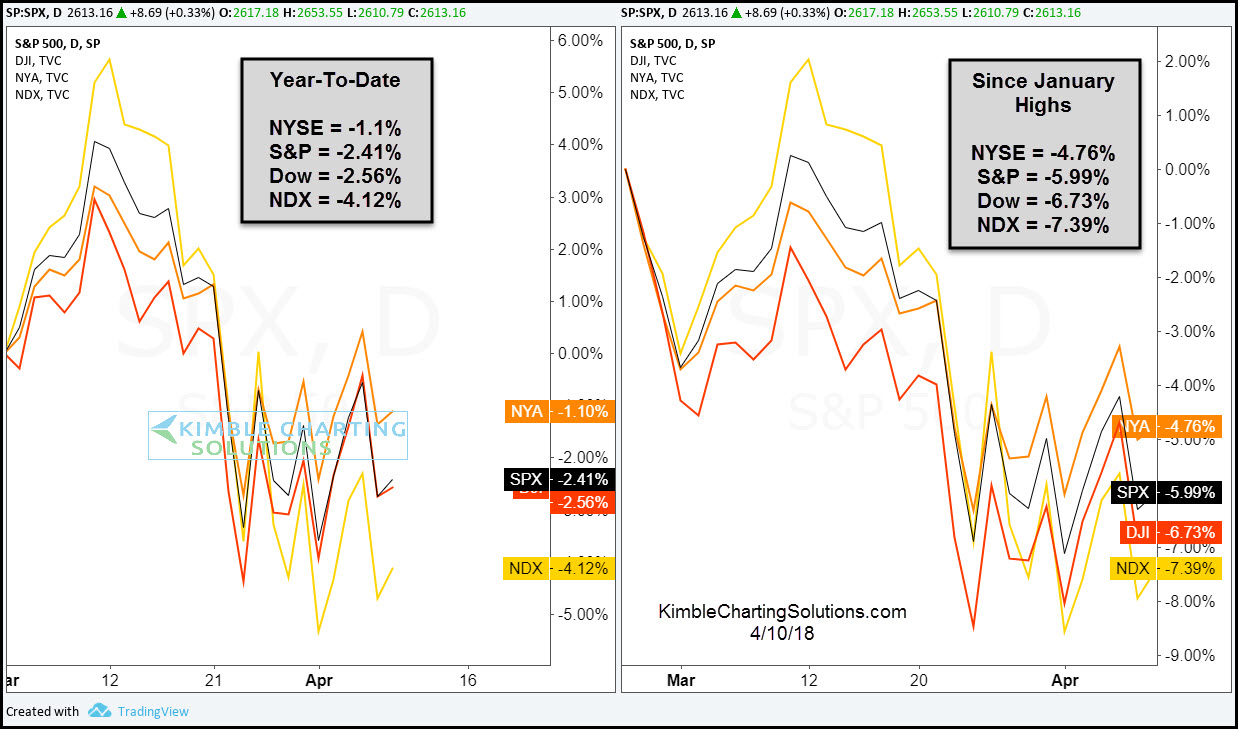
The chart above looks at performance numbers of several key indices on a Year-To-Date basis and from the highs in January. Both highlight that these indices are soft and mostly choppy so far this year.
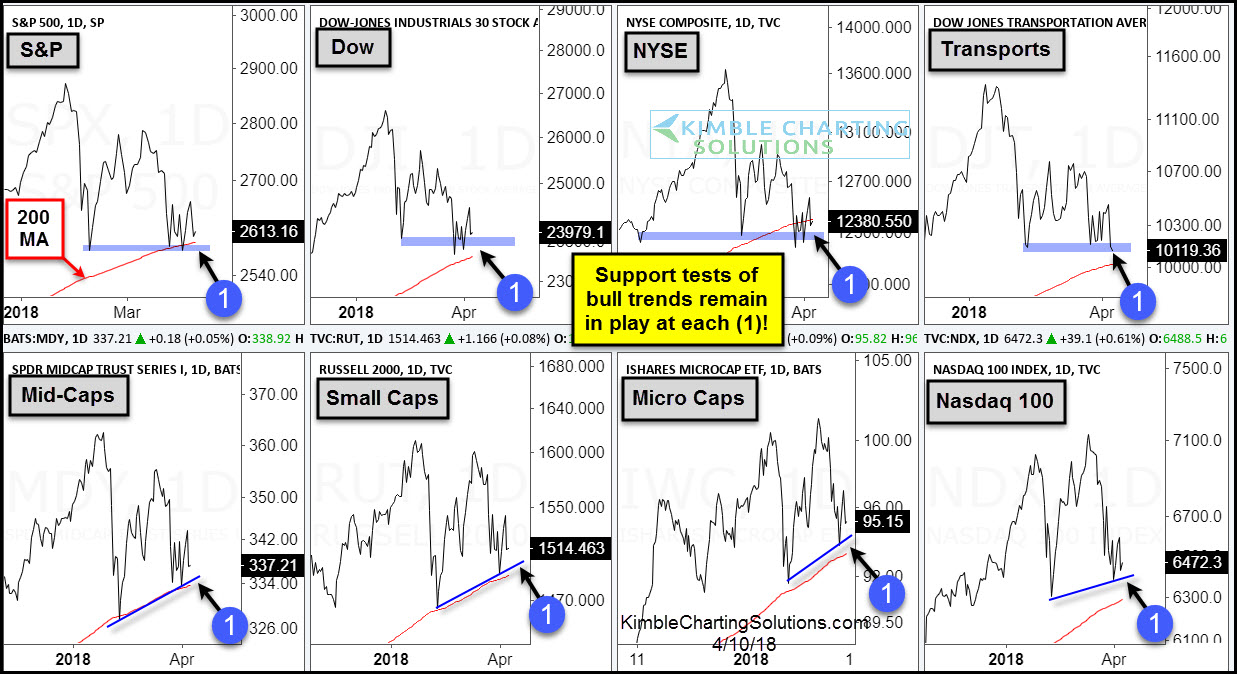
The 8-pack below looks numerous stock indices from large to small-
 CLICK ON CHART TO ENLARGE
Even though the majority of these indices are down this year and several percent below highs hit in January, the 8-pack above reflects that each index remains above support (February lows) and 200-day moving averages at each (1).
From a short-term perspective, these support points at each (1) are price points where one should not be surprised to see rallies take place.
2-year rising trends remain in play at each (1) and each index is above February lows and rising 200MA lines. It would take a break of these support points to change the 2-year trends.
The big test for each index should come when they rally and test a series of lower highs off the January highs. What each index does at the test of lower highs, could well determine performance for months to come.
–
