
CLICK ON CHART TO ENLARGE
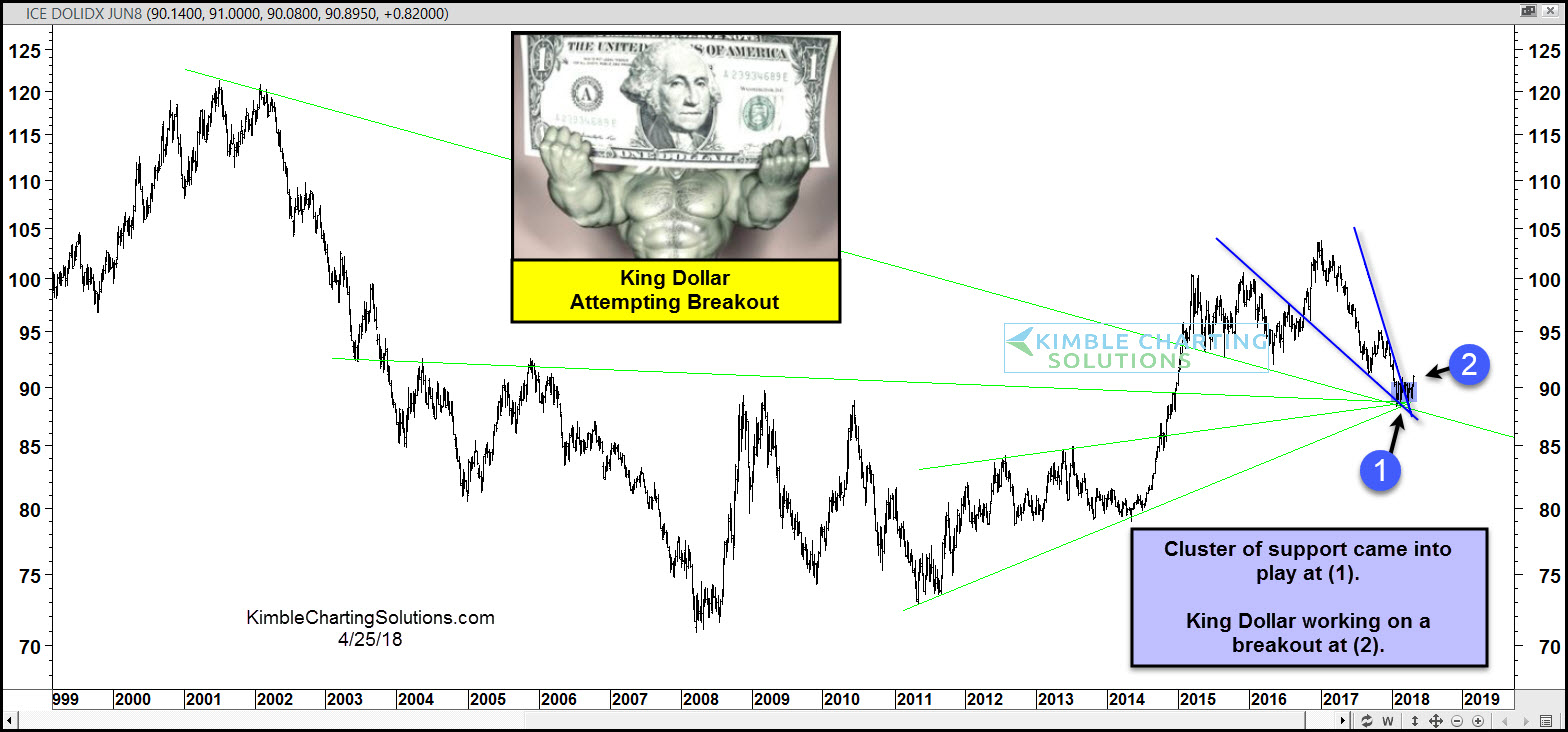
The above chart looks at the US Dollar over the past 20-years.
Numerous potential support lines came in to play at (1), at the same time a bullish falling wedge looks to be coming to an end.
Strength by King Dollar looks to be taking place at (2), where it is working on a breakout.
A rally by King Dollar often times puts downward pressure on metals and could do the same to the overall commodity markets. Commodity bulls do not want to see King Dollar remain strong at (2) and push higher!
–
