
Are Gold Bugs fans about to receive positive news they haven’t had in years? Possible!
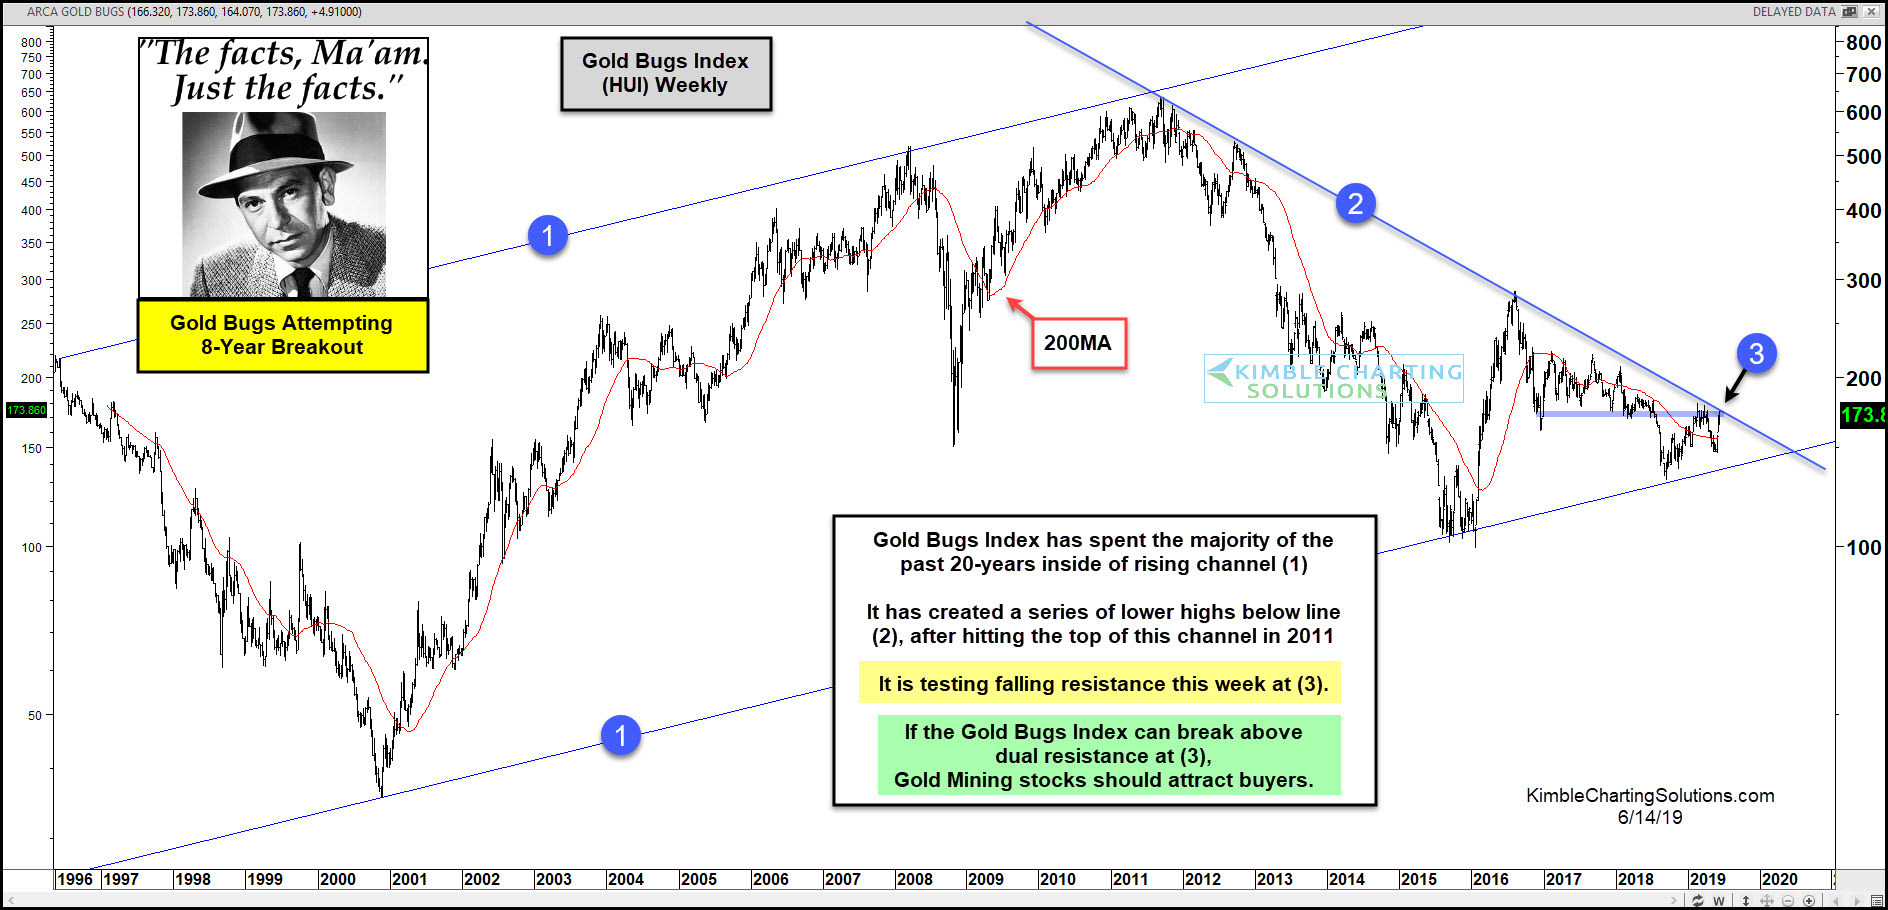
This chart looks at the Gold Bugs Index (HUI) on a weekly basis over a couple of decades. The index has spent the majority of the past 20-year inside of rising channel (1).
The index hit the top of the channel in 2011, where it peaked and started creating a series of lower highs for the past 8-years, which has formed line (2).
The index is now kissing the underside of falling resistance and the underside the 2016/2017 lows at (3).
Joe Friday Just The Facts Ma’am; The Gold bugs index is attempting to break out above “heavy” resistance at (3). If it succeeds, look for it to attract buyers and rally several percent.
If a breakout takes place at (3), look for GDX and GDXJ to do well!
–
