877-721-7217 services@kimblechartingsolutions.com
  • Twitter
  • Twitter
  • Terms of Use
  • Contact
0 Items
Kimble Charting Solutions
  • Blog Sign Up
  • Free Research (Blog)
  • Research Subscriptions
    • Most Popular Research
    • Premium Member Research
    • Weekly Research Reports
  • What We Do
    • What We Do For You
    • Charts Solve These Investing Challenges
    • What You Receive
  • About Us
    • About Us
    • Testimonials
    • Videos
    • As Seen On
  • Login
Select Page
Market Crash Reversal Patterns “Experiment” With History!

Market Crash Reversal Patterns “Experiment” With History!

by Chris Kimble | Apr 8, 2020 | Kimble Charting

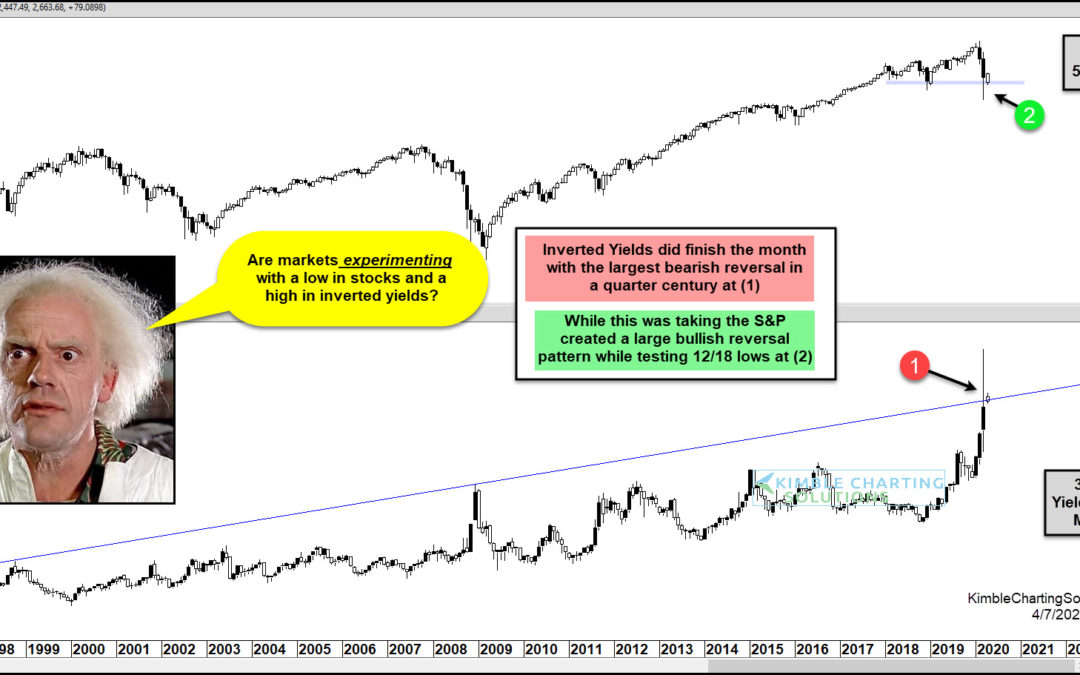
S&P 500 Index versus “Inverted” 30 Year Yield “monthly” Chart Stocks and treasury bond yields had a wild (and scary) month of March as the financial markets crashed to new lows. In today’s chart, we highlight this by looking at long-term “monthly” chart of the...

Topic Areas

10-year yield Apple Banks bonds China Commodities Copper CRB Index Crude Oil DAX Doc Copper Dollar Update Dow Jones Emerging Markets Euro GDX gdxj gld gold Gold Bugs Gold Stocks Govt. bonds High Yields Interest Rates Joe Friday Junk Bonds Kimble Charting NASDAQ 100 ndx 100 NYSE Composite QQQ real estate Russell 2000 S&P S&P 500 Shanghai index silver slv SPX spy TLT US dollar What would you do? Wilshire 5000 Yields
  • Terms of Use
  • Contact
  • Twitter

Copyright ©2023 Kimble Charting Solutions. All Rights Reserved | Design by 16Wells