877-721-7217 services@kimblechartingsolutions.com
  • Twitter
  • Twitter
  • Terms of Use
  • Contact
0 Items
Kimble Charting Solutions
  • Blog Sign Up
  • Free Research (Blog)
  • Research Subscriptions
    • Most Popular Research
    • Premium Member Research
    • Weekly Research Reports
  • What We Do
    • What We Do For You
    • Charts Solve These Investing Challenges
    • What You Receive
  • About Us
    • About Us
    • Testimonials
    • Videos
    • As Seen On
  • Login
Select Page
If Australian Dollar Breaks Out, Commodities May Scream Higher!

If Australian Dollar Breaks Out, Commodities May Scream Higher!

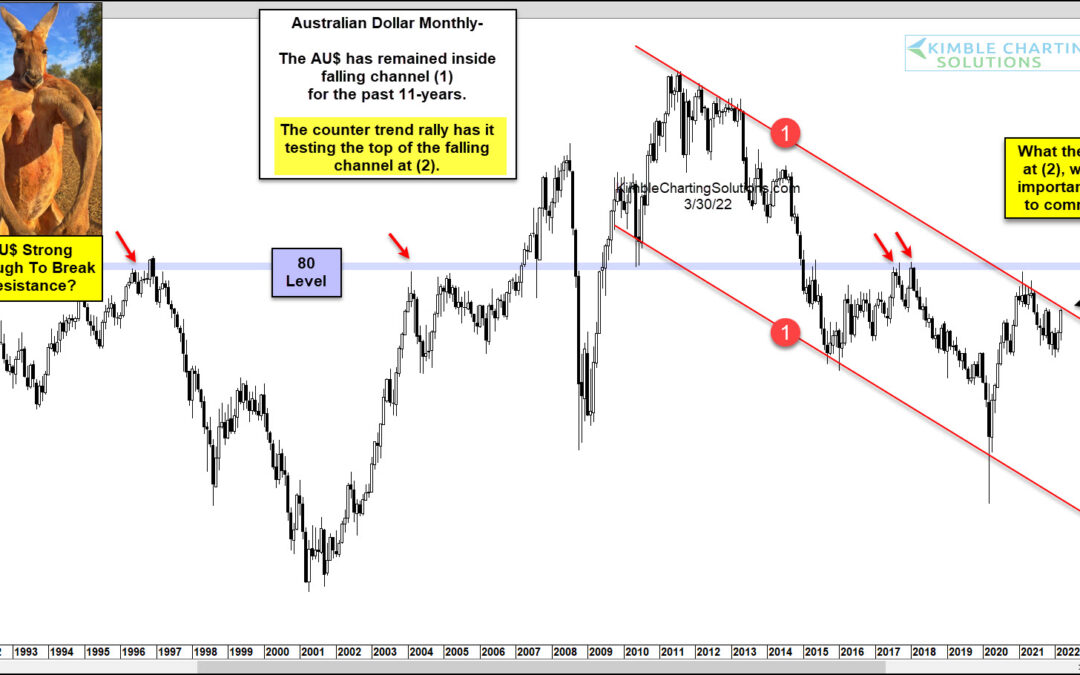
by Chris Kimble | Mar 31, 2022 | Kimble Charting

Over the past 11 years, the Australian Dollar has been in a downtrend. Today’s chart highlights its falling channel marked by each (1). Could we be nearing a change in trend? Everything changed after the covid bottom in 2022. Since then, the Australian Dollar ($AU)...
Australian Dollar Decline A Bearish Sign For Commodities

Australian Dollar Decline A Bearish Sign For Commodities

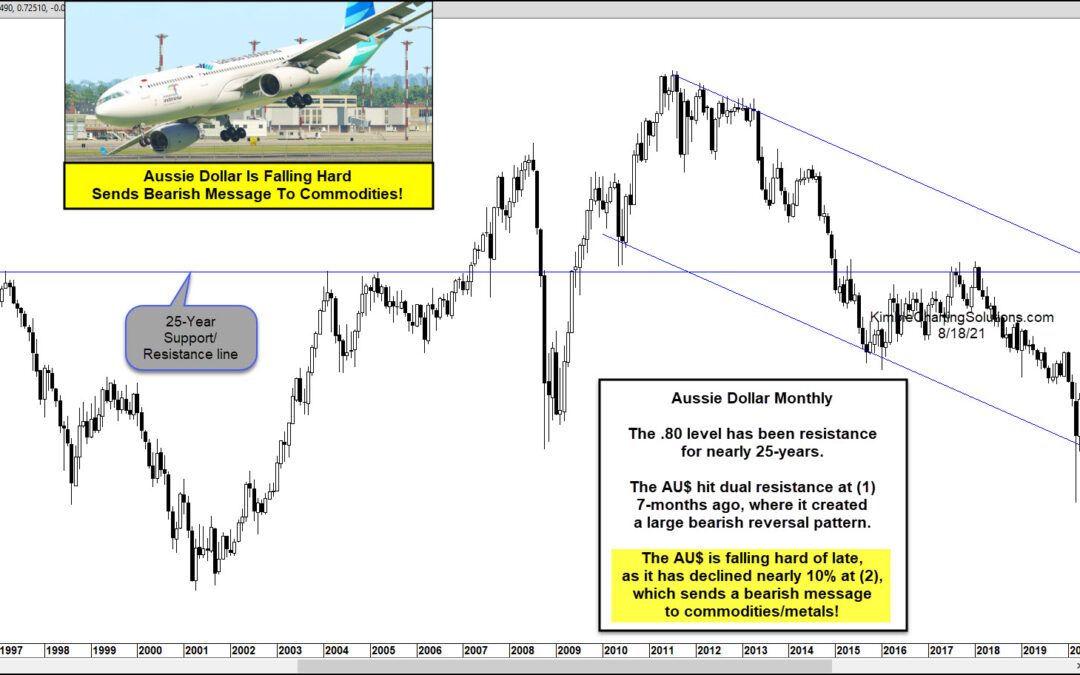
by Chris Kimble | Aug 19, 2021 | Kimble Charting

When the Australian Dollar “moves”, so do commodities. And this time the Australian Dollar “aussie” could be sending a bearish message to commodities. Today’s chart looks at the Aussie Dollar on a “monthly” basis. As you can see, the Aussie Dollar has fallen hard of...

Topic Areas

10-year yield Apple Banks bonds China Commodities Copper CRB Index Crude Oil DAX Doc Copper Dollar Update Dow Jones Emerging Markets Euro GDX gdxj gld gold Gold Bugs Gold Stocks Govt. bonds High Yields Interest Rates Joe Friday Junk Bonds Kimble Charting NASDAQ 100 ndx 100 NYSE Composite QQQ real estate Russell 2000 S&P S&P 500 Shanghai index silver slv SPX spy TLT US dollar What would you do? Wilshire 5000 Yields
  • Terms of Use
  • Contact
  • Twitter

Copyright ©2023 Kimble Charting Solutions. All Rights Reserved | Design by 16Wells