877-721-7217 services@kimblechartingsolutions.com
  • Twitter
  • Twitter
  • Terms of Use
  • Contact
0 Items
Kimble Charting Solutions
  • Blog Sign Up
  • Free Research (Blog)
  • Research Subscriptions
    • Most Popular Research
    • Premium Member Research
    • Weekly Research Reports
  • What We Do
    • What We Do For You
    • Charts Solve These Investing Challenges
    • What You Receive
  • About Us
    • About Us
    • Testimonials
    • Videos
    • As Seen On
  • Login
Select Page
Australian Dollar/U.S. Dollar ratio indicator pegged the lows and continues to suggest even higher prices!

Australian Dollar/U.S. Dollar ratio indicator pegged the lows and continues to suggest even higher prices!

by Chris Kimble | Jun 30, 2012 | Kimble Charting

On 6/7 a reliable currency indicator was suggesting the S&P 500 was at a low and could rally as much as 13% , in the chart below. (see post here)  Prior to calling for this rally, the currency ratio had called for a 7% decline, and the markets followed...
This “Currency indicator” is now suggesting at least a 13% rally in the S&P 500….is that possible again?

This “Currency indicator” is now suggesting at least a 13% rally in the S&P 500….is that possible again?

by Chris Kimble | Jun 7, 2012 | Kimble Charting

The Australian $/U.S.$ ratio has a decent track record for future S&P 500  moves.  On 3/29 this currency ratio was suggesting at least a 7% decline in the S&P 500 should take place (see 7% decline posting) and the S&P 500 declined a little more...
This indicator is predicting a 7% decline in the S&P 500….update-

This indicator is predicting a 7% decline in the S&P 500….update-

by Chris Kimble | Jun 5, 2012 | Kimble Charting

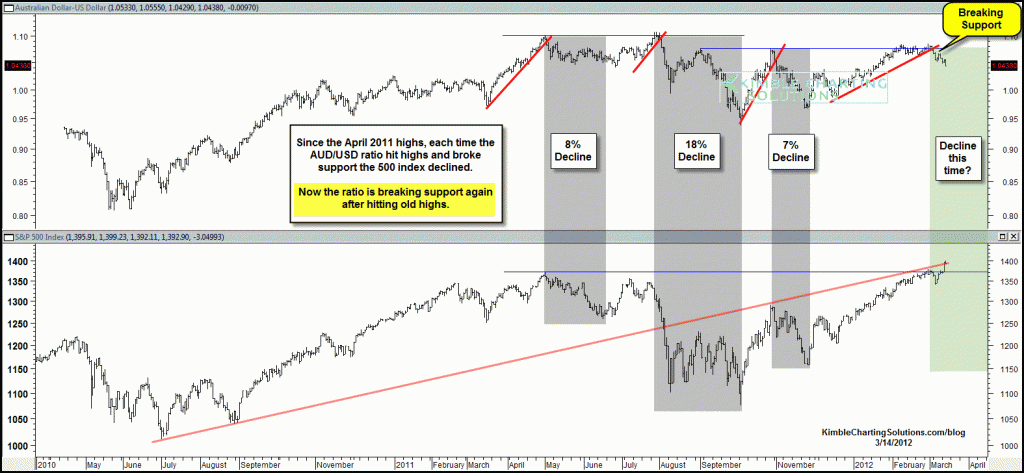
A breakdown of support in the Australian Dollar/U.S. Dollar ratio has led to three declines of 8%, 18% and 7% in the past 12 months! Shared the chart below with Premium members on 3/14 and on the blog March 29th, within 1% of the 2012...
This currency indicator is suggesting at least a 7% decline in the S&P 500 is around the corner….Will it be different this time?

This currency indicator is suggesting at least a 7% decline in the S&P 500 is around the corner….Will it be different this time?

by Chris Kimble | Mar 29, 2012 | Kimble Charting

CLICK ON CHART TO ENLARGE  Shared the above chart with Premium Members on 3/14, reflecting that each time the Australian Dollar/U.S. Dollar ratio broke support over the past 10 months, the S&P 500 fell at least 7% in value.  Below is an update to this...

Topic Areas

10-year yield Apple Banks bonds China Commodities Copper CRB Index Crude Oil DAX Doc Copper Dollar Update Dow Jones Emerging Markets Euro GDX gdxj gld gold Gold Bugs Gold Stocks Govt. bonds High Yields Interest Rates Joe Friday Junk Bonds Kimble Charting NASDAQ 100 ndx 100 NYSE Composite QQQ real estate Russell 2000 S&P S&P 500 Shanghai index silver slv SPX spy TLT US dollar What would you do? Wilshire 5000 Yields
  • Terms of Use
  • Contact
  • Twitter

Copyright ©2023 Kimble Charting Solutions. All Rights Reserved | Design by 16Wells