
by Chris Kimble | Mar 29, 2014 | Kimble Charting
CLICK ON CHART TO ENLARGE One month ago the Power or the Pattern shared that white hot Bio Tech (IBB) looked to be facing stiff resistance at a very important Fibonacci extension level. (See chart here). At the time members shorted this ETF and since then IBB...

by Chris Kimble | Mar 28, 2014 | Kimble Charting
CLICK ON CHART TO ENLARGE If I had told you a month ago that Google, Tesla and Bio-Tech would fall -7% to -15% , would you have thought the S&P 500 would be “FLAT” if that happened? Well it did and I suspect that surprised more than...

by Chris Kimble | Mar 25, 2014 | Kimble Charting
CLICK ON CHART TO ENLARGE The left side of Eiffel tower patterns are fun if long. The right side of Eiffel Tower patterns are not near the fun…. if one remains long. If one harvests longs at the peak or is short on the right side of the Eiffel pattern,...
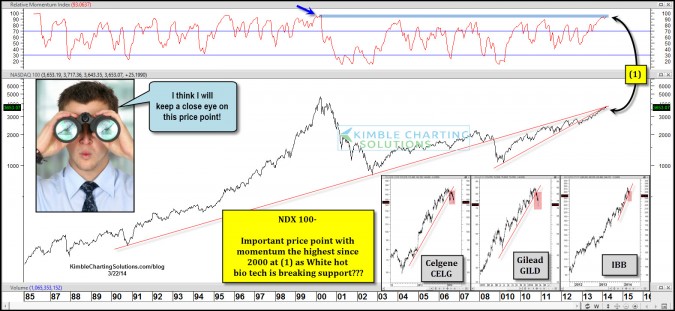
by Chris Kimble | Mar 22, 2014 | Kimble Charting
CLICK ON CHART TO ENLARGE Since the 2009 lows, tech has done very well, up over 190% in the past 5 years. This rally has pushed momentum to levels not seen in 14 years! We have to go back to the dot.com peak to find momentum this high. At the same time momentum...

by Chris Kimble | Mar 7, 2014 | Kimble Charting
CLICK ON CHART TO ENLARGE Who is the Leader of the stock market pack? One candidate would be the Biotech sector, as its been white hot! Biotech ETF IBB has gained 50% more than the S&P 500 over the past year alone. The left chart above takes a 10-year view...

by Chris Kimble | Mar 5, 2014 | Kimble Charting
CLICK ON CHART TO ENLARGE If one believes in buy low and sell higher, do these charts look interesting? The charts above are Google, Bio-tech ETF (IBB) and Tesla inverted. Inverting these chart reflects a different perspective on the strong rallies these three have...

by Chris Kimble | Mar 1, 2014 | Kimble Charting
CLICK ON CHART TO ENLARGE I believe it can be valuable, to pay close attention to leadership…. stock and political leadership! The hottest sector in the States is Biotech and the hottest index on the planet, over the past two years in the Nikkei. The...

by Chris Kimble | Feb 21, 2012 | Kimble Charting
CLICK ON CHART TO ENLARGE Since the October broad market lows, XBI is up almost twice as much as the 500 Index. In the past when the Biotech ETf (XBI) broke below rising support it seems like the S&P 500 followed its path in short order. Is the breakdown in...
