
by Chris Kimble | Jan 28, 2014 | Kimble Charting
CLICK ON CHART TO ENLARGE My Mentor, Sir John Templeton, was a strong believer in “buy at the point of maximum pessimism!” Unless you live under a rock, you are well aware that Emerging markets have not only had a few rough years, they’ve also...
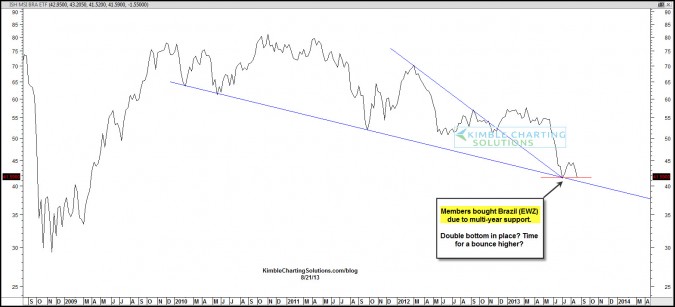
by Chris Kimble | Sep 9, 2013 | Kimble Charting
CLICK ON CHART TO ENLARGE Shared the chart above with Premium & Sector/Commodity Sentiment extreme members as well as Stocktwits (here), that Brazil ETF EWZ looked to have formed a “Double Bottom” in the chart above. CLICK ON CHART TO ENLARGE The chart...
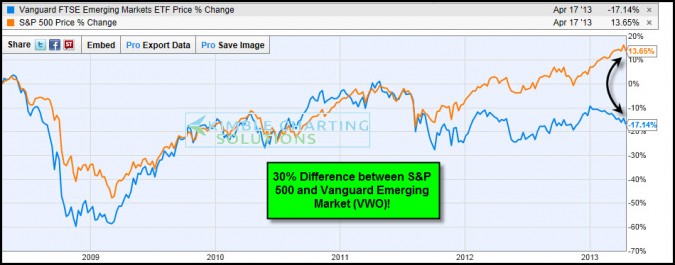
by Chris Kimble | Apr 18, 2013 | Kimble Charting
CLICK ON CHART TO ENLARGE Emerging markets are the growth engines of the world? Heard this pitch for years? Could this pitch be the reason that 2 of the 4 largest ETF’s in the world are Emerging markets ETF’s, despite relative weak performance...

by Chris Kimble | Sep 5, 2012 | Kimble Charting
We’ve heard that the BRIC countries (Brazil, Russia, India & China) are to be the growth engines of the world for several years now. I believe in time they will, yet once the Shanghai Index broke below its multi-year flag pattern, they have all...
by Chris Kimble | Mar 29, 2012 | Kimble Charting
CLICK ON CHART TO ENLARGE Emerging Markets/BRIC ETF’s continue to create a series of lower highs and of late are acting pretty tired (reflecting relative weaknesss) compared to the broad markets in the states. Keep eye on Emerging Markets to see if they turn...

by Chris Kimble | Sep 21, 2011 | Kimble Charting
I am honored that one third of this blogs viewers come from outside of the United States. Of late I have received numerous email requests from the international viewers, to update the look of the Emerging markets. See below… CLICK ON CHART TO...

by Chris Kimble | May 3, 2011 | Kimble Charting
Emerging Market ETF’s are “Sub-Merging” of late, as key support is breaking! CLICK ON CHART TO ENLARGE Is this price action a tip-off to what the results of the “Shanghai Flag” pattern will take? (see post here). ...

by Chris Kimble | Oct 22, 2010 | Kimble Charting
Emerging markets, especially some of the smaller countries have been “HOT PERFORMERS” over the last 6 months, as the U.S. Dollar has declined over 15% since it peaked in June. See performace below, compared to the 500 index! CLICK ON CHART TO...
