by Chris Kimble | Feb 16, 2024 | Kimble Charting
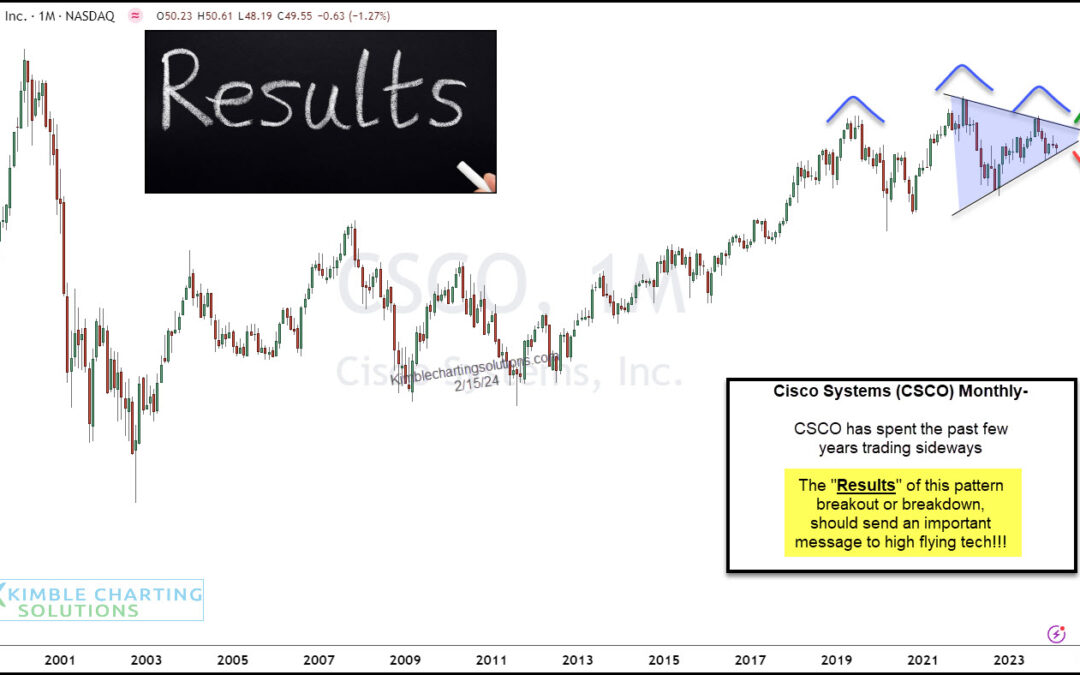
Cisco (CSCO) used to be one of the four horsemen of the Nasdaq (tech stocks) rally. While CSCO still has plenty of influence as a large-cap leader in the Semiconductor Sector, it is under-performing its peers and trading in a pennant pattern. In short, Cisco has...

by Chris Kimble | Mar 21, 2013 | Kimble Charting
CLICK ON CHART TO ENLARGE Two-thirds of the time rising wedges break to the downside. (Nasd Comp/upper left). Has the NDX 100 made “TOO” perfect of a head & shoulders topping pattern as the left and right shoulder are the same distance apart? (upper...

by Chris Kimble | Nov 11, 2010 | Kimble Charting
Should you “sweat” resistance? I would if long, due to resistance and the wide spread in the chart below, which is reflecting that very few investors are sweating at current price levels. In the chart below, posted on 11/8 (see...
