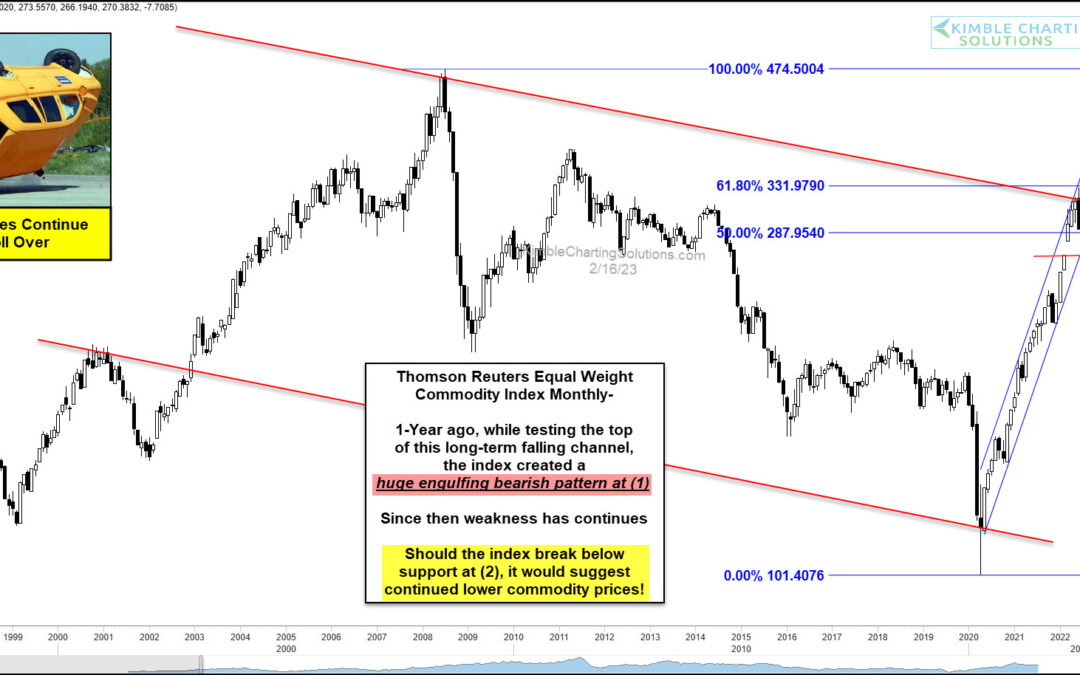
877-721-7217 services@kimblechartingsolutions.com
  • Twitter
  • Twitter
  • Terms of Use
  • Contact
0 Items
Kimble Charting Solutions
  • Blog Sign Up
  • Free Research (Blog)
  • Research Subscriptions
    • Most Popular Research
    • Premium Member Research
    • Weekly Research Reports
  • What We Do
    • What We Do For You
    • Charts Solve These Investing Challenges
    • What You Receive
  • About Us
    • About Us
    • Testimonials
    • Videos
    • As Seen On
  • Login
Select Page
Commodities Breaking Out, Suggesting Bull Market Is Ahead!

Commodities Breaking Out, Suggesting Bull Market Is Ahead!

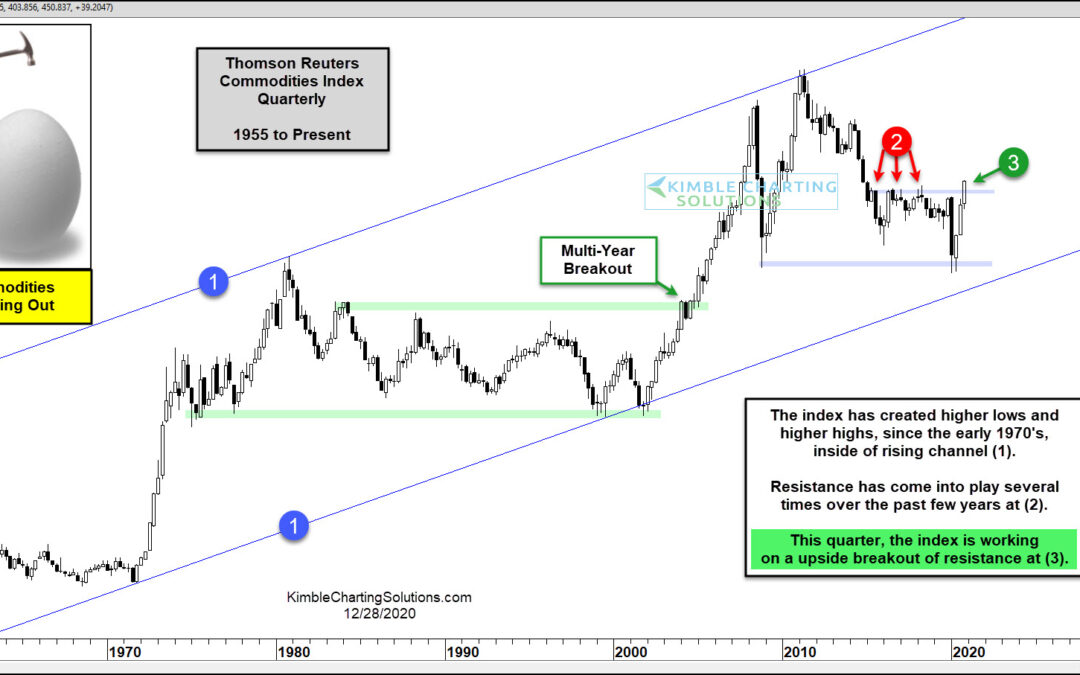
by Chris Kimble | Dec 28, 2020 | Kimble Charting

Are Commodities ending a 5-year trading range, inside of a 50-year bull trend? Sure is looking like it! This chart looks at the TR Equal Weight Commodity Index, based upon quarterly pricing, dating back to the 1950s. Since the early 1970s, the index has created a...

Topic Areas

10-year yield Apple Banks bonds China Commodities Copper CRB Index Crude Oil DAX Doc Copper Dollar Update Dow Jones Emerging Markets Euro GDX gdxj gld gold Gold Bugs Gold Stocks Govt. bonds High Yields Interest Rates Joe Friday Junk Bonds Kimble Charting NASDAQ 100 ndx 100 NYSE Composite QQQ real estate Russell 2000 S&P S&P 500 Shanghai index silver slv SPX spy TLT US dollar What would you do? Wilshire 5000 Yields
  • Terms of Use
  • Contact
  • Twitter

Copyright ©2022 Kimble Charting Solutions. All Rights Reserved | Design by 16Wells