by Chris Kimble | May 11, 2013 | Kimble Charting
CLICK ON CHART TO ENLARGE Consumer Discretionary and Consumer Staples ETF’s have been white hot over the past 5 years. The table below reflects that Staples (XLP) has gained over twice and Discretionary (XLY) three times as much as the S&P 500 over the...

by Chris Kimble | Oct 6, 2011 | Kimble Charting
CLICK ON CHART TO ENLARGE TLT is back at its 2008 highs….”Twin Peaks” in play along (1)? Check out the action in the inset box of TLT along line (1)..NOT BULLISH, yet Support line (2) remains in place. A break at (2) should usher in a ton...

by Chris Kimble | Jun 2, 2011 | Kimble Charting
Consumer Staples (XLP), Utilities (XLU) and Health Care (IYH) have reflected very good relative strength over the past 4 months, outperforming the S&P 500 by a good percentage (see inset in 3-pack below). Of late though these often viewed “defensive...

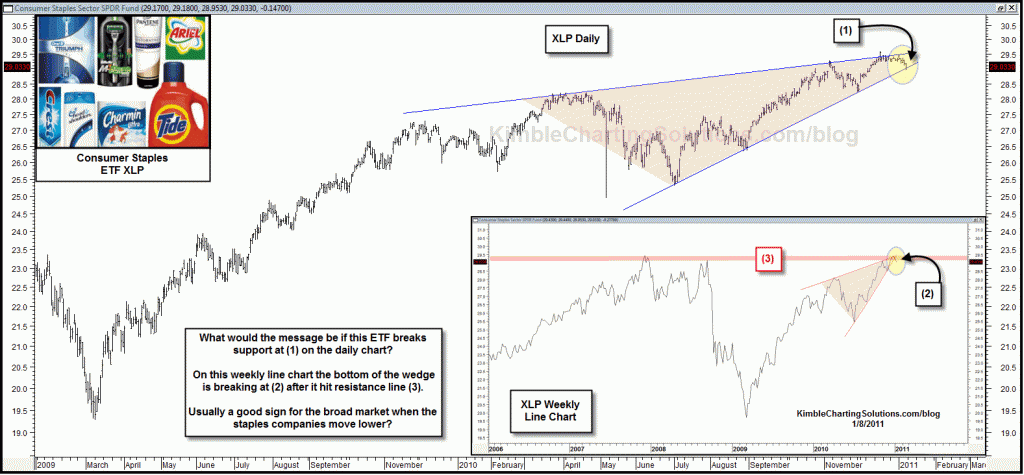
by Chris Kimble | Jan 8, 2011 | Kimble Charting
CLICK ON CHART TO ENLARGE XLP finds itself in a very tricky spot right now at (1) and (2) in the above chart. If the “Power of the Pattern” is correct, this ETF is about to head lower!


