877-721-7217 services@kimblechartingsolutions.com
  • Twitter
  • Twitter
  • Contact
  • Cart
0 Items
Kimble Charting Solutions
  • Blog Sign Up
  • Free Research (Blog)
  • Research Subscriptions
    • Most Popular Research
    • Premium Member Research
    • Weekly Research Reports
  • What We Do
    • What We Do For You
    • Charts Solve These Investing Challenges
    • What You Receive
  • About Us
    • About Us
    • Testimonials
    • Videos
    • As Seen On
  • Login
Select Page
Transports 10-Year Bullish Trend Being Tested! Rally Time or Breakdown?

Transports 10-Year Bullish Trend Being Tested! Rally Time or Breakdown?

by Chris Kimble | Aug 19, 2019 | Kimble Charting

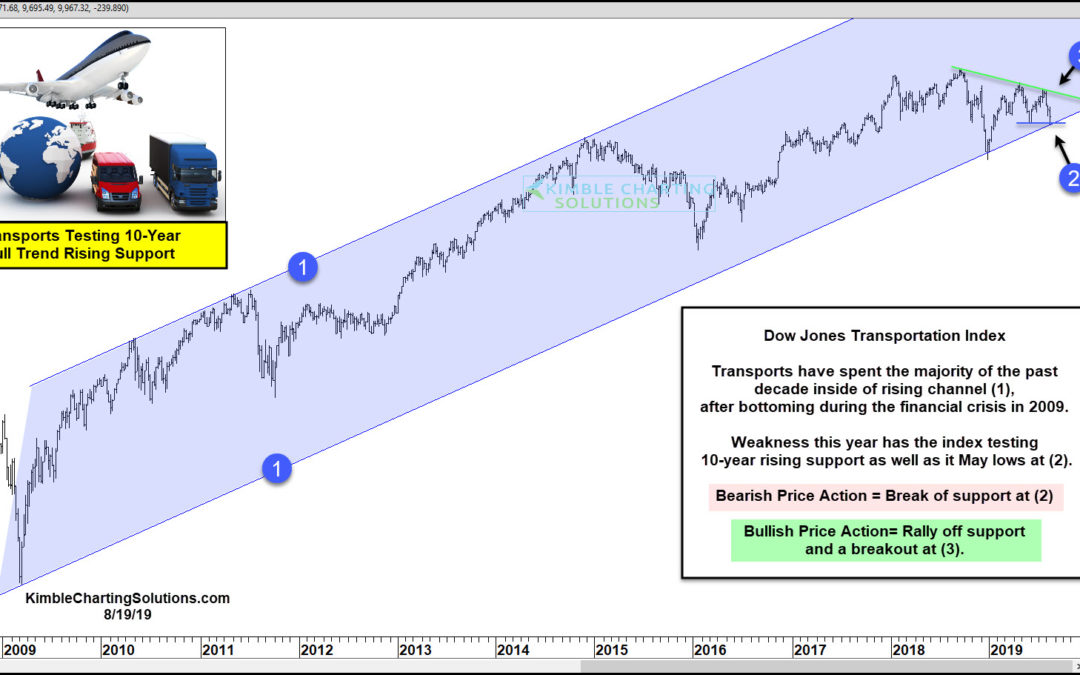
Is the DJ Transportation Index presenting a rare buying opportunity? The broad market most likely hopes so! Transports have spent the majority of the past decade creating a series of higher lows. This pattern has created rising channel (1), which started back in 2009....
Transports; Could be repeating 1999 & 2007 pattern

Transports; Could be repeating 1999 & 2007 pattern

by Chris Kimble | Mar 20, 2017 | Kimble Charting

Below looks at the Dow Jones Transportation Index over the past 20-years. Before we discuss the chart below, let me be clear about this, the trend at this time remains up. The focus of this chart is what the highs in 1999 and 2007 looked like. As you can see, in 1999...

Topic Areas

10-year yield Apple Banks bonds China Commodities Copper CRB Index Crude Oil DAX Dollar Update Dow Jones Emerging Markets Euro GDX gdxj gld gold Gold Bugs Gold Stocks Govt. bonds High Yields Interest Rates Joe Friday Junk Bonds Kimble Charting Mid-Caps NASDAQ 100 ndx 100 Nikkei 225 NYSE Composite real estate Russell 2000 S&P S&P 500 Shanghai index silver slv SPX spy TLT US dollar What would you do? Wilshire 5000 Yields
  • Terms of Use
  • Contact
  • Twitter

Copyright ©2021 Kimble Charting Solutions. All Rights Reserved | Design by 16Wells