
by Chris Kimble | Jan 24, 2014 | Kimble Charting
CLICK ON CHART TO ENLARGE What does 1974 and 2009 have in common? They are two key Emotipoint (Emotional point) lows that have taken place in the past 40-years. 1974 low took place as Richard Nixon was being impeached and the 2009 low took place at the depths...

by Chris Kimble | Jan 2, 2014 | Kimble Charting
CLICK ON CHART TO ENLARGE On the first post of the year, I first off want to wish each of you & yours a “Healthy, Happy & Prosperous 2014.” I also want to Thank each of you for your viewership of my blog, it is deeply appreciated. I remain honored...

by Chris Kimble | Dec 31, 2013 | Kimble Charting
CLICK ON CHART TO ENLARGE As we finish the year, the Dow is up almost 28%. What has the Dow done over the past 5-years? The Dow Jones index has averaged around a 12% gain per year, for the past 5-years… how does that stack up from a historical perspective and...

by Chris Kimble | Nov 18, 2013 | Kimble Charting
CLICK ON CHART TO ENLARGE This morning the Dow reached 16,000 for the first time in history. Sometimes round numbers can be important. The Power of the Pattern would suggest Dow 16,000 is NOT your typical round number. If a person ties together some of the more...

by Chris Kimble | Nov 6, 2013 | Kimble Charting
CLICK ON CHART TO ENLARGE Doug Short created the upper left chart on the Q-ratio and updates it on a regular basis. See latest “Q-Ratio” update and detail of this ratio (HERE) Being a student of Sir John Templeton, I have to look at some fundamental...
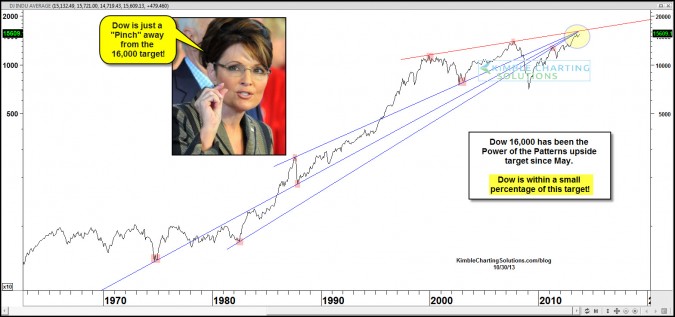
by Chris Kimble | Oct 30, 2013 | Kimble Charting
CLICK ON CHART TO ENLARGE On 4/10/13, when the Dow was around 14,600, the Power of the Pattern suggested that the upside target for the Dow was 16,000. (Dow 16,000 April post) I shared at the Stocktoberfest meeting two weeks ago that Dow 16,000 was a very important...

by Chris Kimble | Sep 13, 2013 | Kimble Charting
CLICK ON CHART TO ENLARGE What does the 1974 Low, 1987 Crash, 2000 High have in Common? Are they some of the most memorable highs and lows over the past 40 years? Yes, Yes & Yes! Do they have anything else in Common? Yes! Each of these important highs/lows...
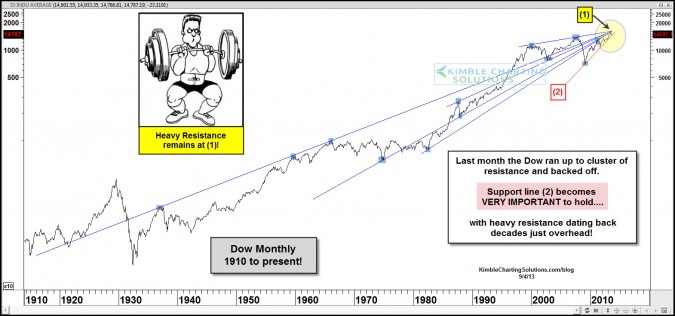
by Chris Kimble | Sep 4, 2013 | Kimble Charting
CLICK ON CHART TO ENLARGE Months ago the Power of the Pattern shared that the Dow could make it to the 16,000 level (see post here) Last month the Dow came within 350 points, less than 3% from the target. The above chart reflects that numerous resistance lines...
