by Chris Kimble | Aug 14, 2012 | Kimble Charting
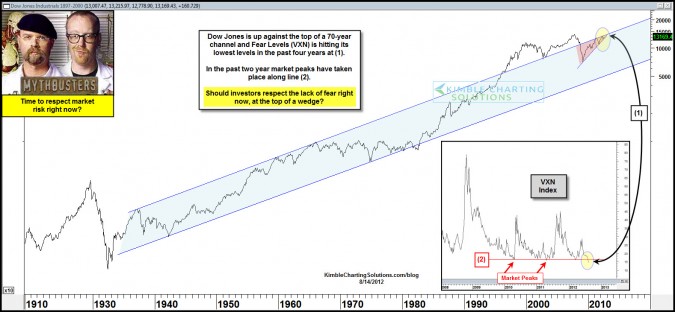
CLICK ON CHART TO ENLARGE The Dow is nearing a 70-year resistance line, at the top of a rising wedge and Fear levels are hitting lows not seen in the past few years. In the past this combo has been a time to be cautious on the markets. Two-thirds of the time a rising...

by Chris Kimble | Jul 24, 2012 | Kimble Charting
CLICK ON CHART TO ENLARGE Currently the Dow and S&P 500 are very near multi-decade rising channel lines and look to be forming bearish rising wedges. Forecasting and chart analysis is an art, not a science. Even though rising wedges break to the...

by Chris Kimble | Jun 25, 2012 | Kimble Charting
CLICK ON CHART TO ENLARGE The “Macro Monday” chart of the day is the Dow from 1910 to Current. The Dow is currently near the top of its 70-year rising channel and looks to have formed a multi-year rising wedge at the same time at (1) in the...

by Chris Kimble | Dec 30, 2011 | Kimble Charting
CLICK ON CHART TO ENLARGE On the last trading day of the year, its common for the media to look back over the last 12 months. I wanted to close out the year looking back a little further. From a big picture perspective the charts above continue to suggest...

by Chris Kimble | Aug 16, 2011 | Kimble Charting
Posted the chart below on 5/23, reflecting that the Dow was facing key resistance and channel lines, dating back almost 70-years. At that time the Dow stood at 12,500 (see post here) CLICK ON CHART TO ENLARGE The above chart reflected important resistance...

by Chris Kimble | Aug 5, 2011 | Kimble Charting
Is the market due a bounce after yesterdays 500 point decline? Odds are very high on a short-term basis, a bounce is due…. just check out the VIX. During these times I am of the belief it is can be helpful to look at long-term charts for a little...

by Chris Kimble | May 23, 2011 | Kimble Charting
CLICK ON CHART TO ENLARGE Currently the Dow is facing 70-year channel resistance…This resistance does not mean this market has to turn tail and head south at this time!. Several “Multi-decade” lines all meeting at (2) should very much be...
by Chris Kimble | Feb 11, 2011 | Kimble Charting
CLICK ON CHART TO ENLARGE Several LONG-TERM resistance lines are facing the Dow right now at (1) in the above chart. The long-term resistance in the Dow should be respected!!!
