by Chris Kimble | Apr 14, 2020 | Kimble Charting
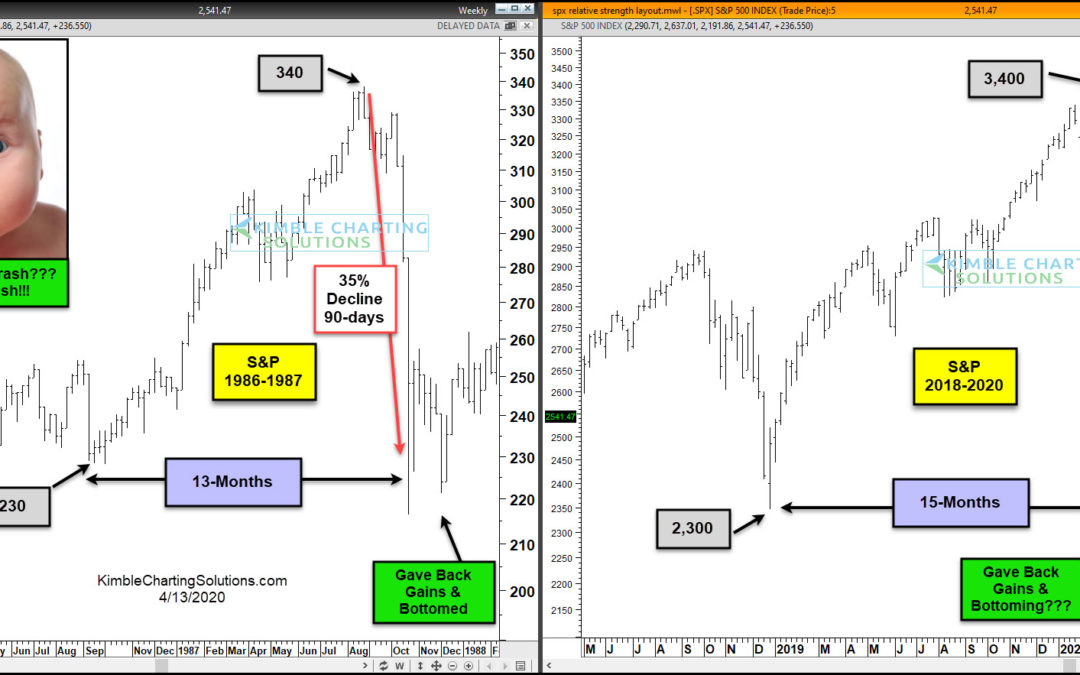
The market action of late reminds me of what I experienced in 1987. If we are repeating the 87 stock market crash, it could be bullish, as the lows could be in play already. In today’s 2-pack, I highlight the similarities and what to watch for. In 1986-1987 (left...
by Chris Kimble | Aug 7, 2019 | Kimble Charting
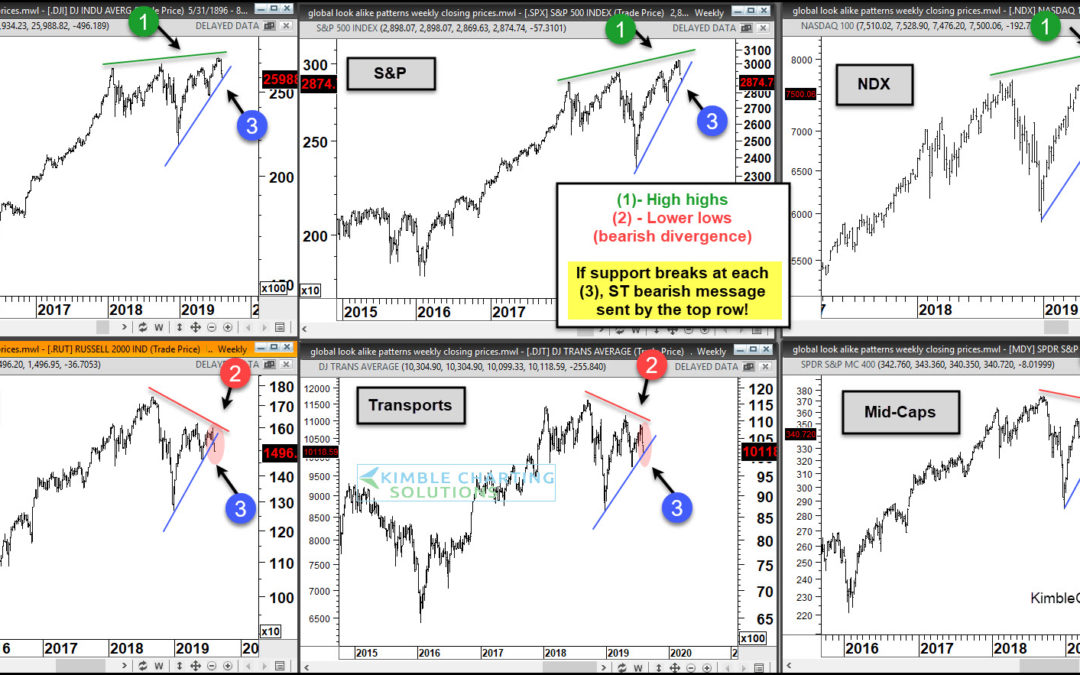
Stock Market Indexes Topping? Well, that was fast. The stock market pullback has been sharp and likely is not over yet. Last week, I shared the same chart, calling it a “moment of truth” for the stock market. Would the 3 underperforming stock market indexes (in the...
by Chris Kimble | Oct 18, 2018 | Kimble Charting
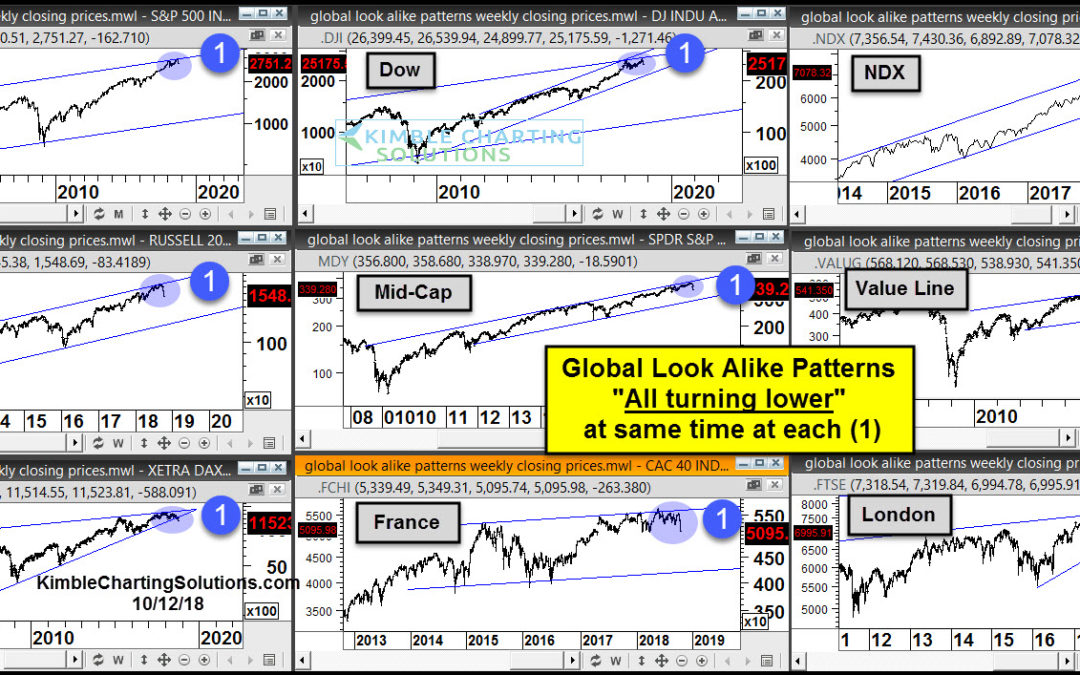
Over the past several weeks, I’ve shared several examples of key stock market indexes and indicators hitting long-term resistance. Today, we’ll do the same… but with a much wider lens. We’ll look at 9 different stock market indexes in the developed markets that look...
by Chris Kimble | Aug 22, 2018 | Kimble Charting
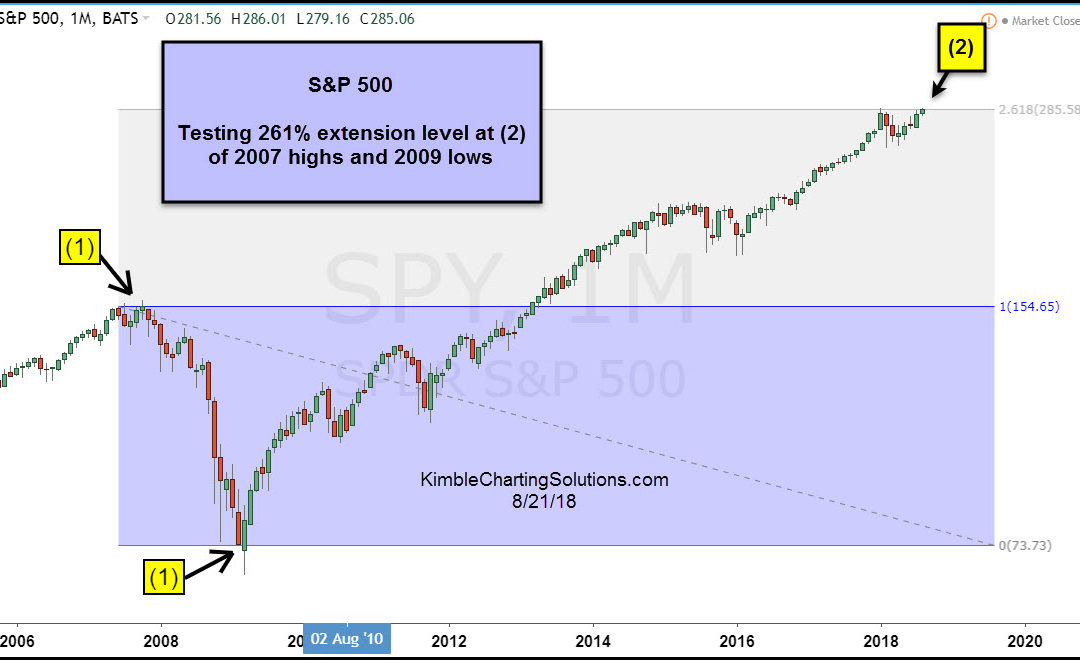
Will these chart patterns lead the bulls into a buying stampede or will Fibonacci extension levels become 800-pound resistance zones that will frustrate stock bulls? In my 38-years I haven’t seen so many stock market indices testing Fibonacci extension levels at the...
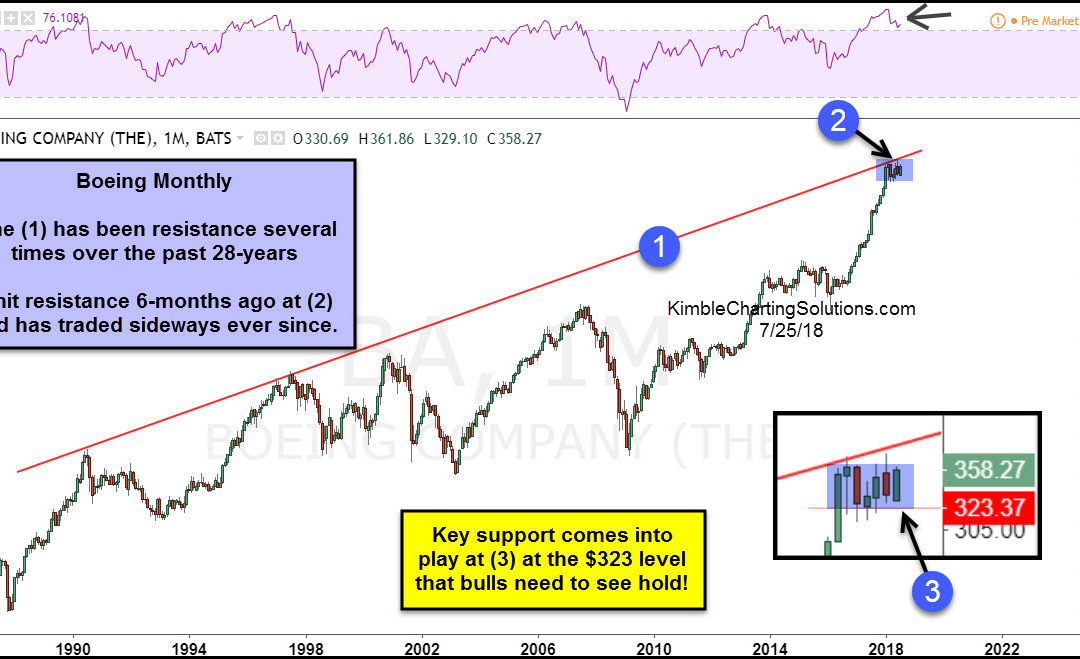
by Chris Kimble | Jul 25, 2018 | Kimble Charting
CLICK ON CHART TO ENLARGE Boeing has been in a leadership role over the past few years, as it has far outpaced the Dow and S&P 500 to the upside. The trend for Boeing remains up and price action of late has not changed this trend. 6-months ago Boeing hit rising...
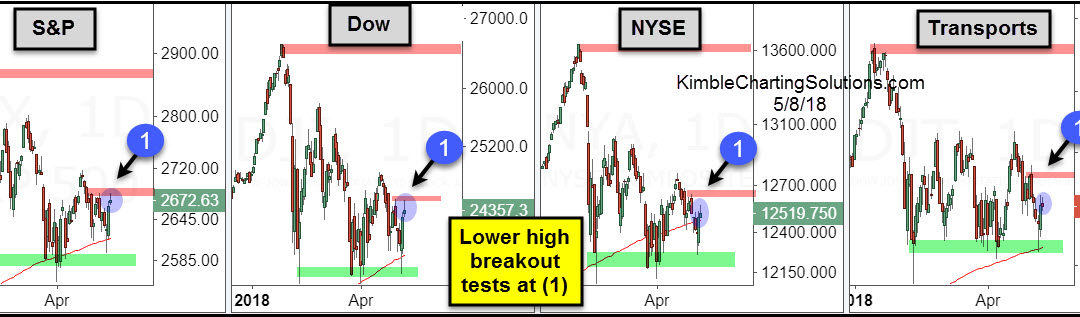
by Chris Kimble | May 8, 2018 | Kimble Charting
CLICK ON CHART TO ENLARGE This 4-pack looks at a few popular stock indices since the first of this year on a daily basis. Each Index peaked in January, creating the top of the trading range and each bottomed in February, creating the bottom of the trading range. Over...
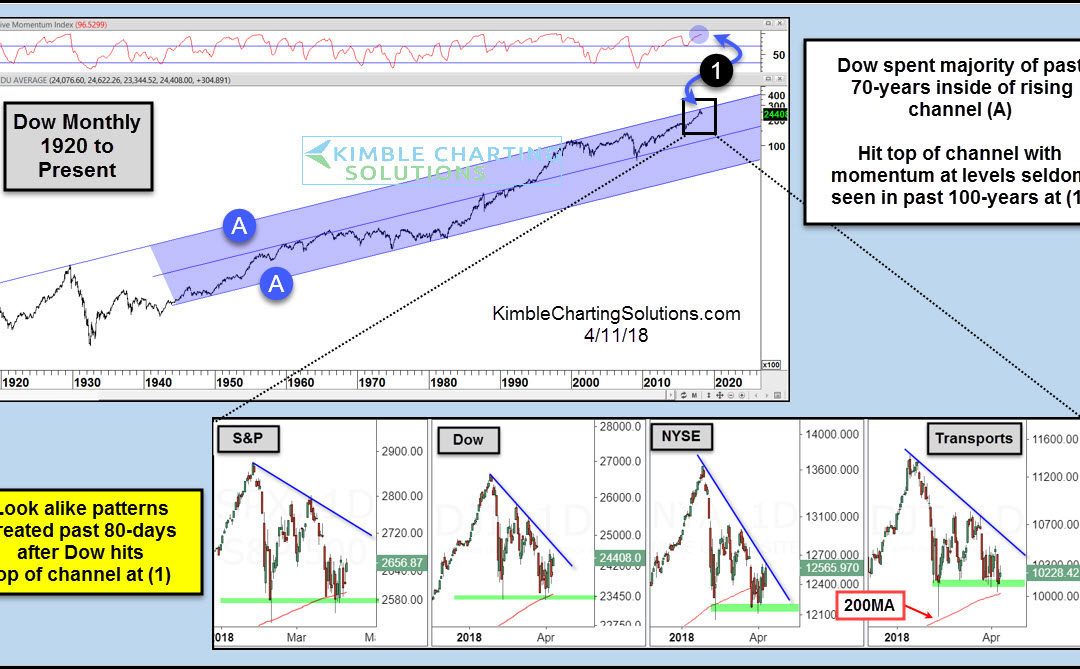
by Chris Kimble | Apr 11, 2018 | Kimble Charting
CLICK ON CHART TO ENLARGE The Dow has spent the majority of the past 70-years inside of bullish rising channel (A). It hit the top of this channel in January at (1), as monthly momentum was hitting levels last seen in 2007, 2000, 1987, 1957 and 1929. The 4-pack...
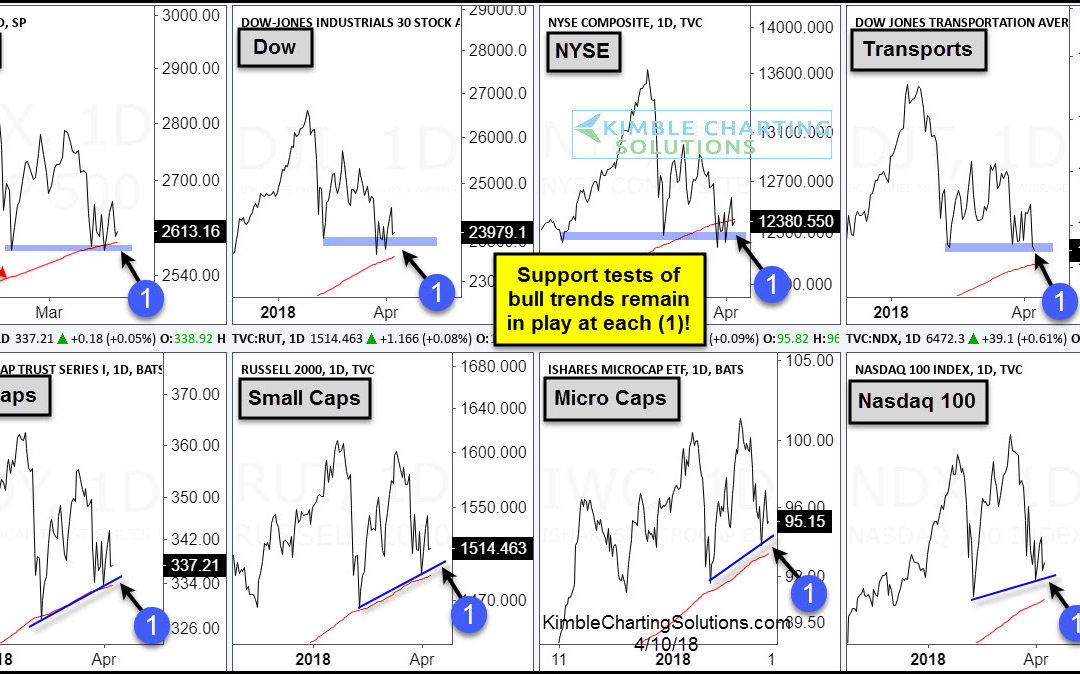
by Chris Kimble | Apr 10, 2018 | Kimble Charting
CLICK ON CHART TO ENLARGE The chart above looks at performance numbers of several key indices on a Year-To-Date basis and from the highs in January. Both highlight that these indices are soft and mostly choppy so far this year. The 8-pack below looks numerous stock...
