877-721-7217 services@kimblechartingsolutions.com
  • Twitter
  • Twitter
  • Terms of Use
  • Contact
0 Items
Kimble Charting Solutions
  • Blog Sign Up
  • Free Research (Blog)
  • Research Subscriptions
    • Most Popular Research
    • Premium Member Research
    • Weekly Research Reports
  • What We Do
    • What We Do For You
    • Charts Solve These Investing Challenges
    • What You Receive
  • About Us
    • About Us
    • Testimonials
    • Videos
    • As Seen On
  • Login
Select Page
Energy ETF (XLE)- Breakout test in play, 20% gain in store?

Energy ETF (XLE)- Breakout test in play, 20% gain in store?

by Chris Kimble | Aug 7, 2018 | Kimble Charting

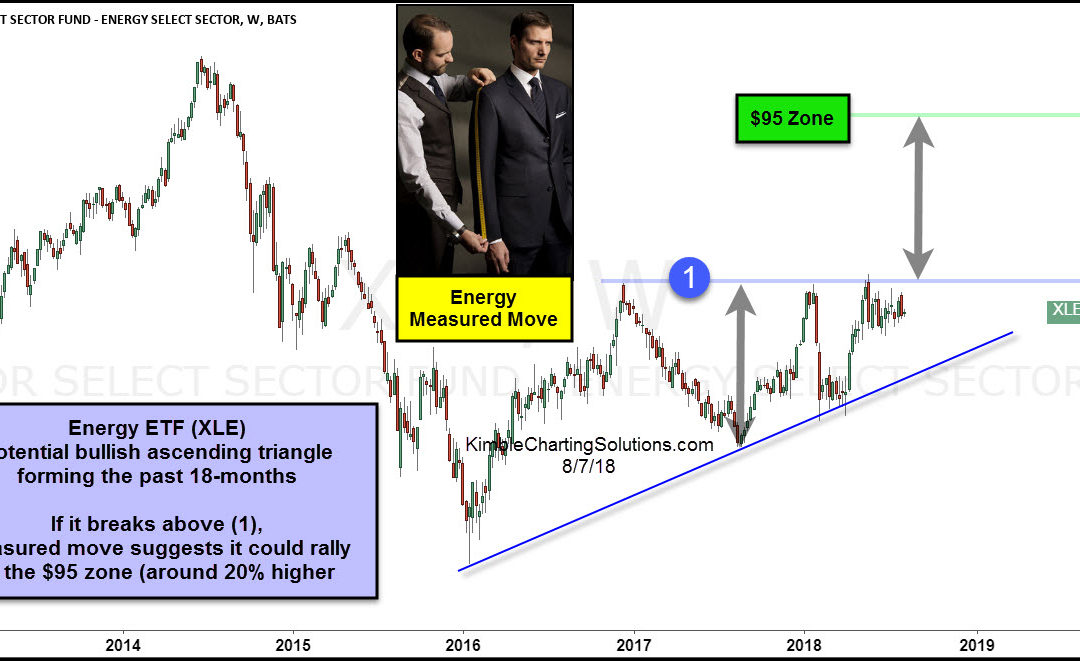
CLICK ON CHART TO ENLARGE Energy ETF (XLE) has struggled to get above the $80 level while creating a series of higher lows over the past 18-months. This price action could be creating a bullish ascending triangle pattern. The top of the pattern comes into play at the...
Post election winners facing breakout tests, says Joe Friday

Post election winners facing breakout tests, says Joe Friday

by Chris Kimble | Jan 27, 2017 | Kimble Charting

If I told you that some assets have done really well post election, would that surprise you or the majority? Nah! What assets have done well post election or seem to be in the news of late? A strong rise in Banks, Materials, Energy and Interest Rates are just a few...
Groundhog Day conditions about to end for the 500, NDX 100 & Russell 2000?

Groundhog Day conditions about to end for the 500, NDX 100 & Russell 2000?

by Chris Kimble | Aug 25, 2010 | Kimble Charting

The top chart was published on 8/8, reflecting a bearish situation for the 500 index… facing Fibonacci resistance at the peak of a rising wedge.  At  (1) the post suggested to “harvest at resistance or take positions to score on defense. The “Power...

Topic Areas

10-year yield Apple Banks bonds China Commodities Copper CRB Index Crude Oil DAX Doc Copper Dollar Update Dow Jones Emerging Markets Euro GDX gdxj gld gold Gold Bugs Gold Stocks Govt. bonds High Yields Interest Rates Joe Friday Junk Bonds Kimble Charting NASDAQ 100 ndx 100 NYSE Composite QQQ real estate Russell 2000 S&P S&P 500 Shanghai index silver slv SPX spy TLT US dollar What would you do? Wilshire 5000 Yields
  • Terms of Use
  • Contact
  • Twitter

Copyright ©2023 Kimble Charting Solutions. All Rights Reserved | Design by 16Wells