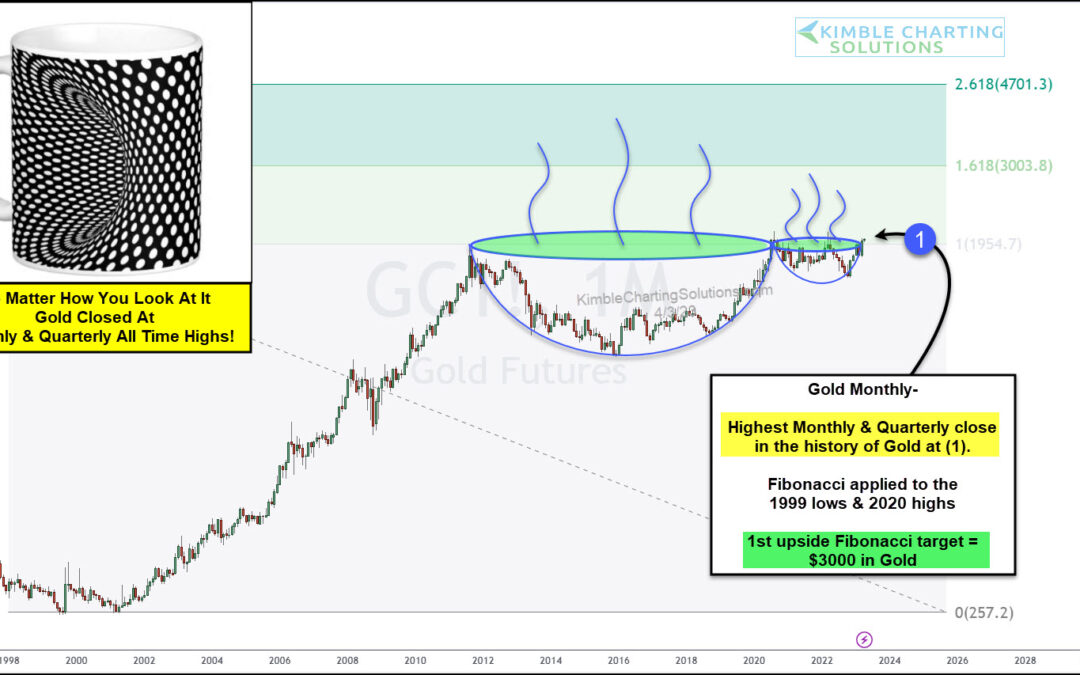
by Chris Kimble | Apr 4, 2023 | Kimble Charting
Gold prices remain elevated as inflation, political differences, and the prospect of international war radiate on the horizon. This prospect of uncertainty tends to be where gold finds buyers at higher prices. Today, we revisit a pattern that we have highlighted...
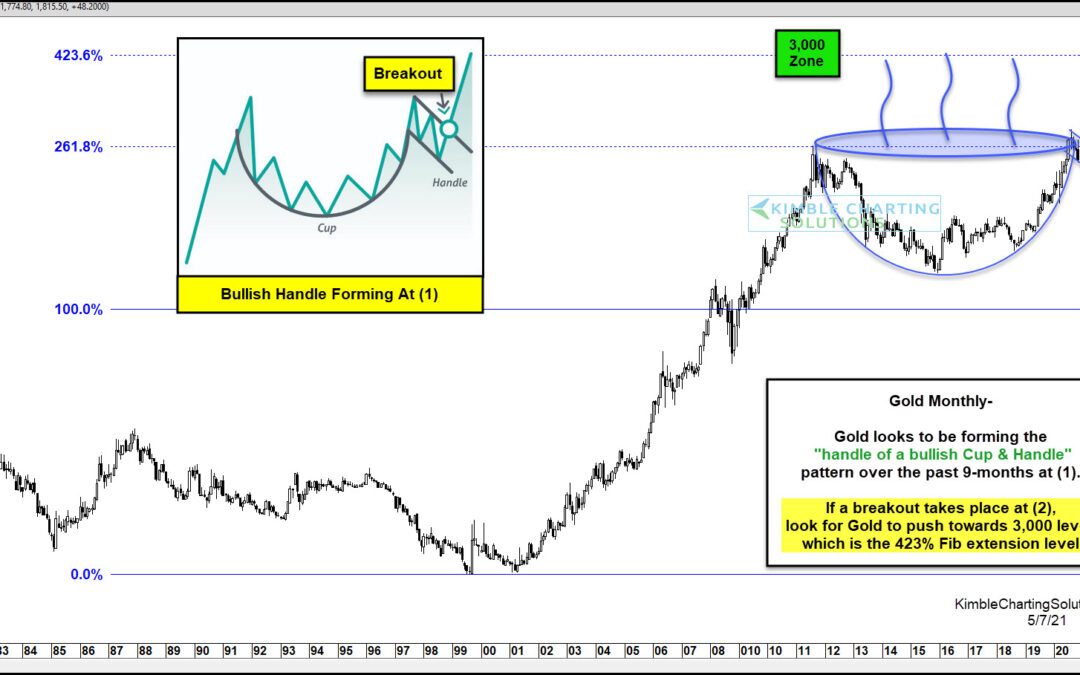
by Chris Kimble | May 8, 2021 | Kimble Charting
Okay, so we are having a little bit of fun here… but this really is a massively bullish pattern for Gold. And we have been tracking this Gold cup with handle pattern since early 2020. Read our last update here. As you can see in the “monthly” Gold chart above, the...
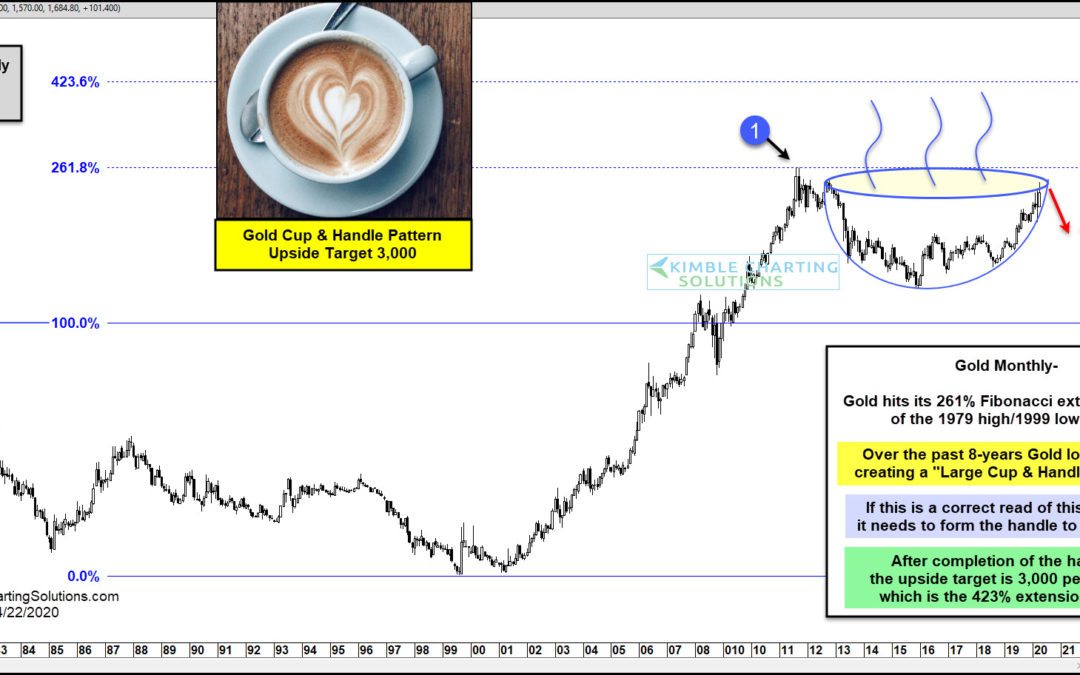
by Chris Kimble | Apr 22, 2020 | Kimble Charting
In 2011, Gold bugs were gushing with bullish sentiment as Gold prices rallied sharply before peaking around $1900. That peak formed at the 261.8 percent Fibonacci extension of the 1979 high / 1999 low at (1) on today’s chart. The next 8 years saw Gold prices enter a...
