by Chris Kimble | Feb 25, 2020 | Kimble Charting
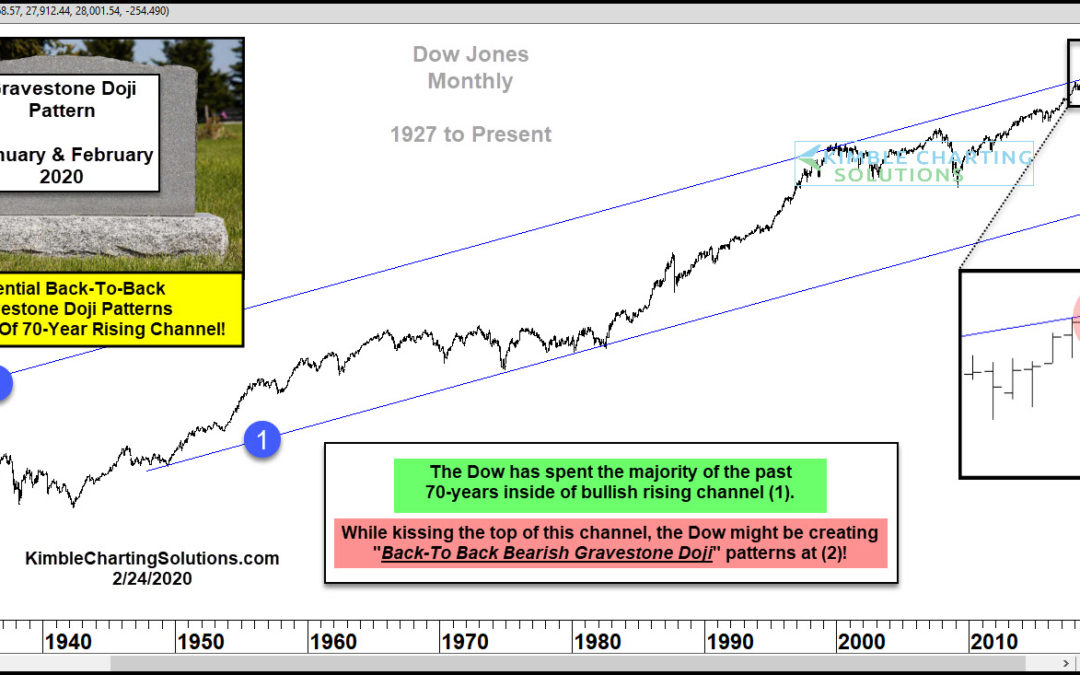
Dow Jones Industrial Average “monthly” Chart The Dow Industrials have spent the past 70 years in a wide rising price channel marked by each (1). And the past 25 years have seen prices test and pull back from the upper end of that channel. The current bull market cycle...
