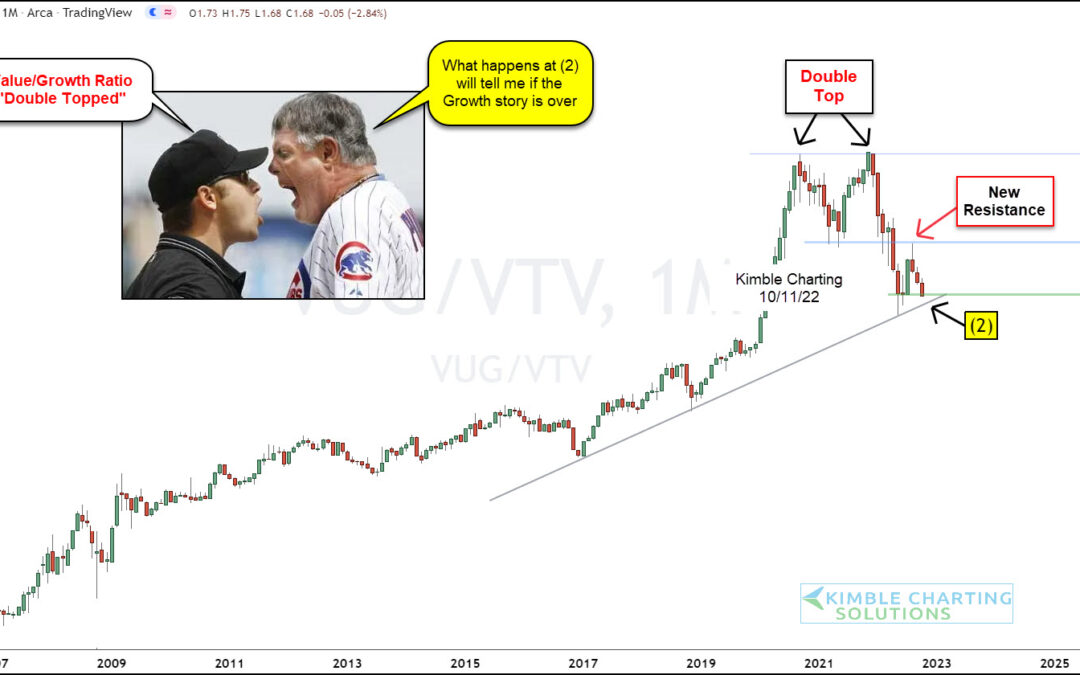
by Chris Kimble | Oct 12, 2022 | Kimble Charting
It’s pretty simple. Growth stocks do not perform well when indicators like a strengthening US Dollar, rising interest rates, and slowing growth take place. Hence, see the chart above This is a ratio of the Growth Stocks ETF (VUG) to the Value Stocks ETF (VTV). And...
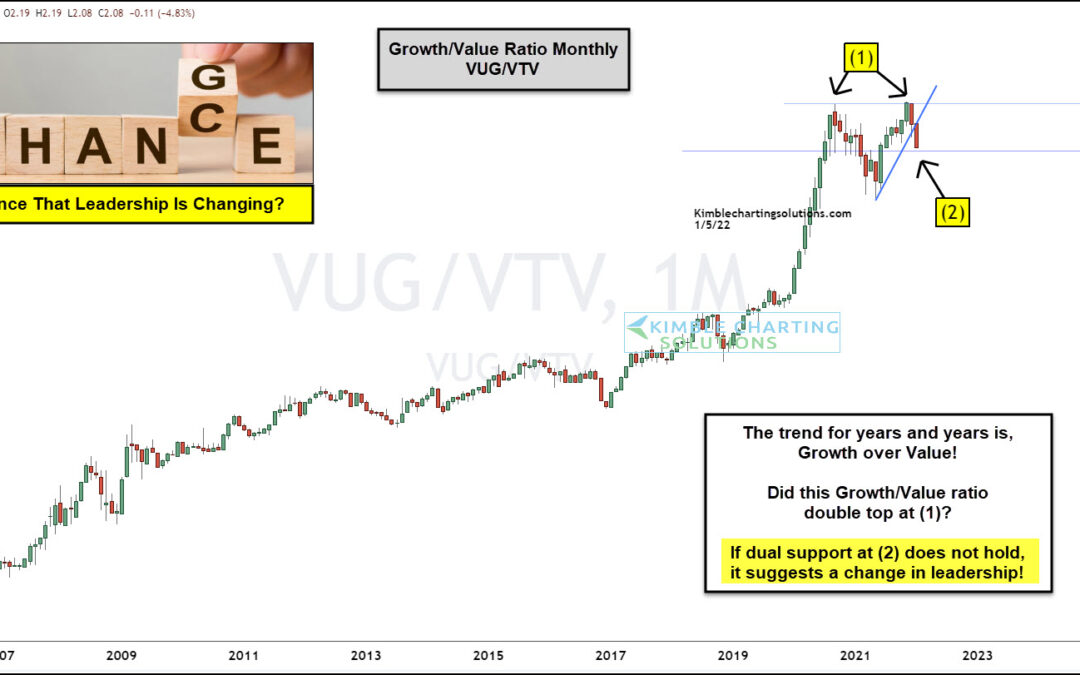
by Chris Kimble | Jan 7, 2022 | Kimble Charting
Growth stocks have out-performed value stocks for nearly 15 years, with a major surge from 2017 to 2020. But the past two years have seen this turn into more of a tug-o-war as value stocks attempt to regain long-lost favor. Is a reversal of fortune underway? It...
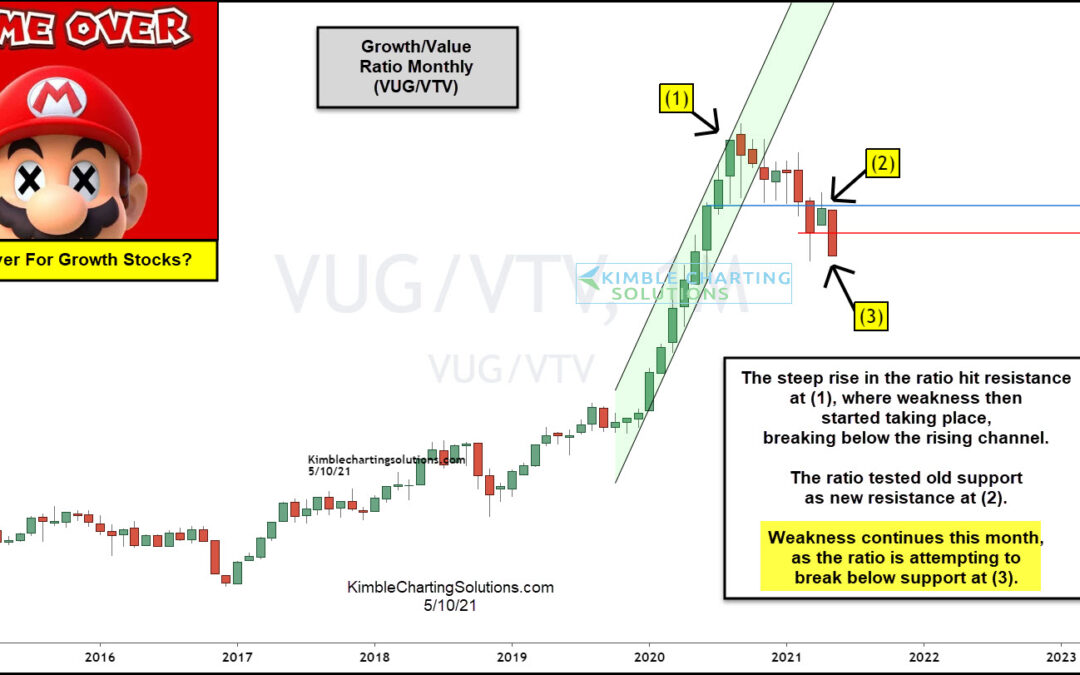
by Chris Kimble | May 11, 2021 | Kimble Charting
One of the most exciting and relentless investing trends of the past 4 years is the strength in growth stocks versus value stocks. But that trend is in jeopardy… and may be signaling caution to the broader market as high beta growth stocks continue to slide in 2021....

by Chris Kimble | Mar 21, 2015 | Kimble Charting
CLICK ON CHART TO ENLARGE Value/Growth ratio… spent about a year and of late has broken out. Discretionary/Staples ratio…pushing above a pennant patter, with support in place that started back in 2010 Russell/S&P ratio… hit support in October of...
