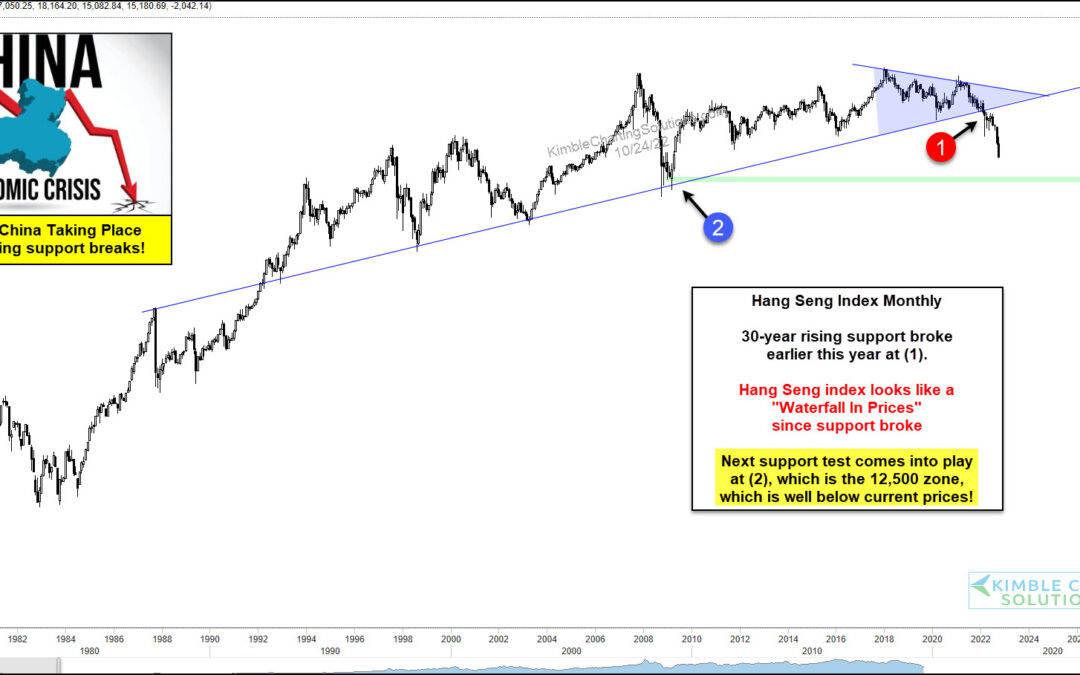
by Chris Kimble | Oct 25, 2022 | Kimble Charting
Global equity markets have come under heavy volatility this year, with leading markets like the US, China, and Europe declining swiftly. China’s Hang Seng index in particular has sounded alarm bells, and we have been highlighting the importance of its bearish pattern...

by Chris Kimble | Feb 23, 2022 | Kimble Charting
As the eyes of the world are on Russia and Ukraine (and Putin versus Biden), what happens next in the Chinese markets could be a big deal as well! The Chinese economy has the ability to tip the scales of the global economy and one of its leading indicators is flashing...
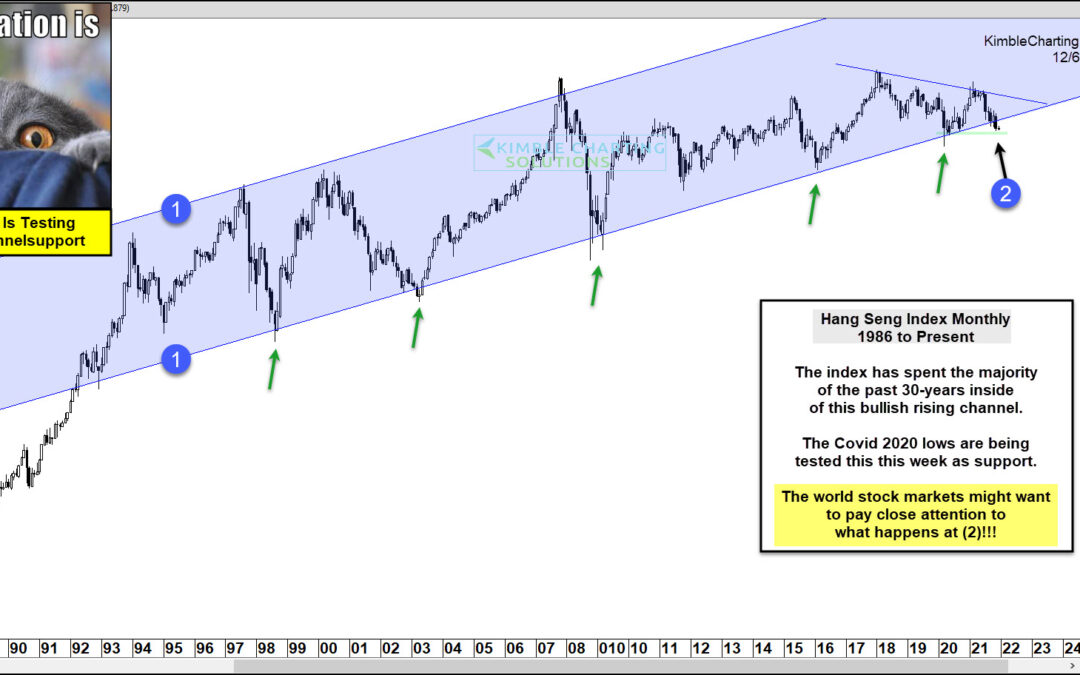
by Chris Kimble | Dec 6, 2021 | Kimble Charting
China’s rise to a global economic powerhouse has come in fits and starts. And the last 5 years would be categorized as fits. This can also be seen on the Hang Seng stock market index (Hong Kong). And should this index decline much further, global markets may throw a...
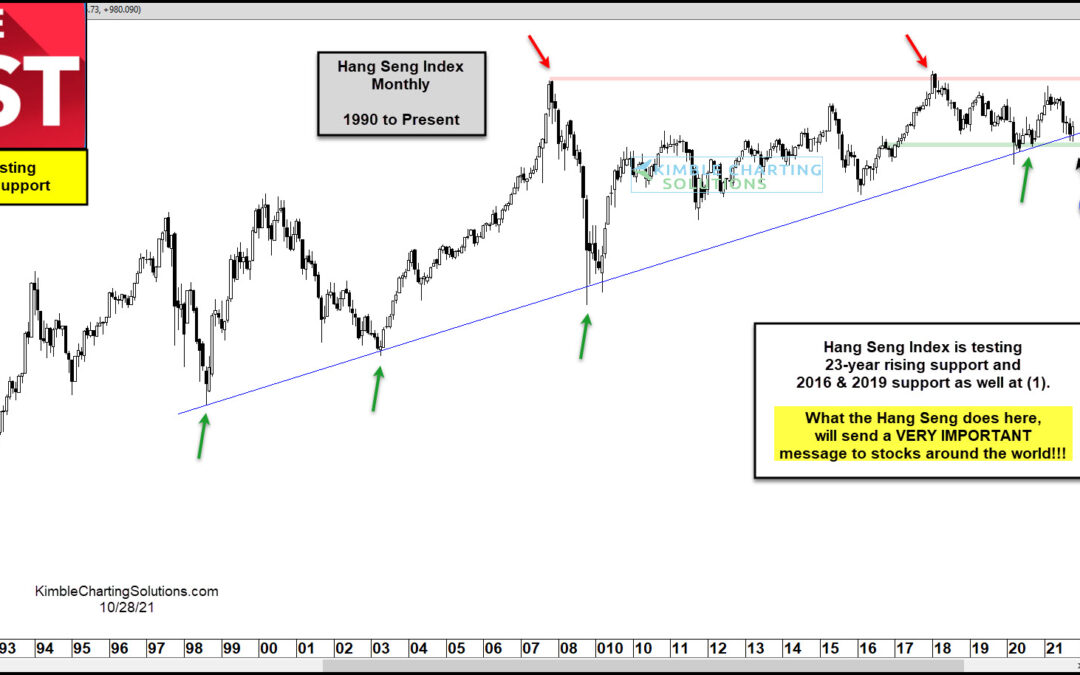
by Chris Kimble | Oct 29, 2021 | Kimble Charting
Amidst the on-going concerns about COVID, inflation, and a potential energy crisis, we also have China to worry about. That is, the Chinese stock market. And in particular, the Hang Seng Index. For the past few month, we have heard worries about the global economy and...
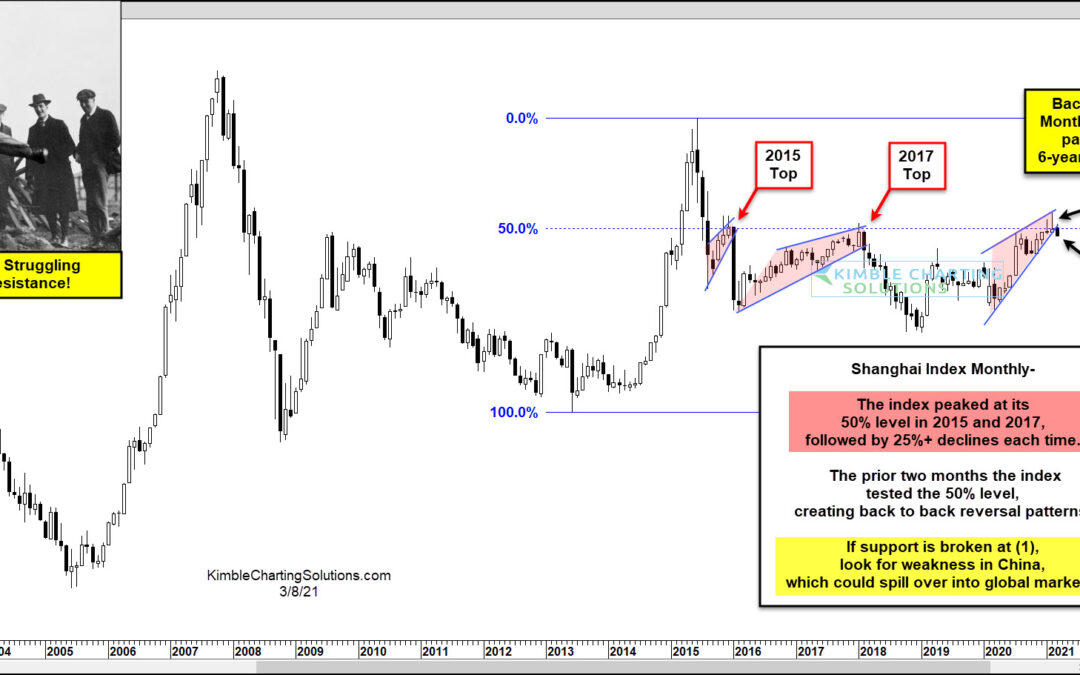
by Chris Kimble | Mar 8, 2021 | Kimble Charting
Could China be sending an important message to stocks around the world? Very possible! This chart looks at the Shangai Index on a monthly basis since the early 2000s. The index has peaked twice in the past 6-yeas at its 50% Fibonacci retracement level. These peaks...
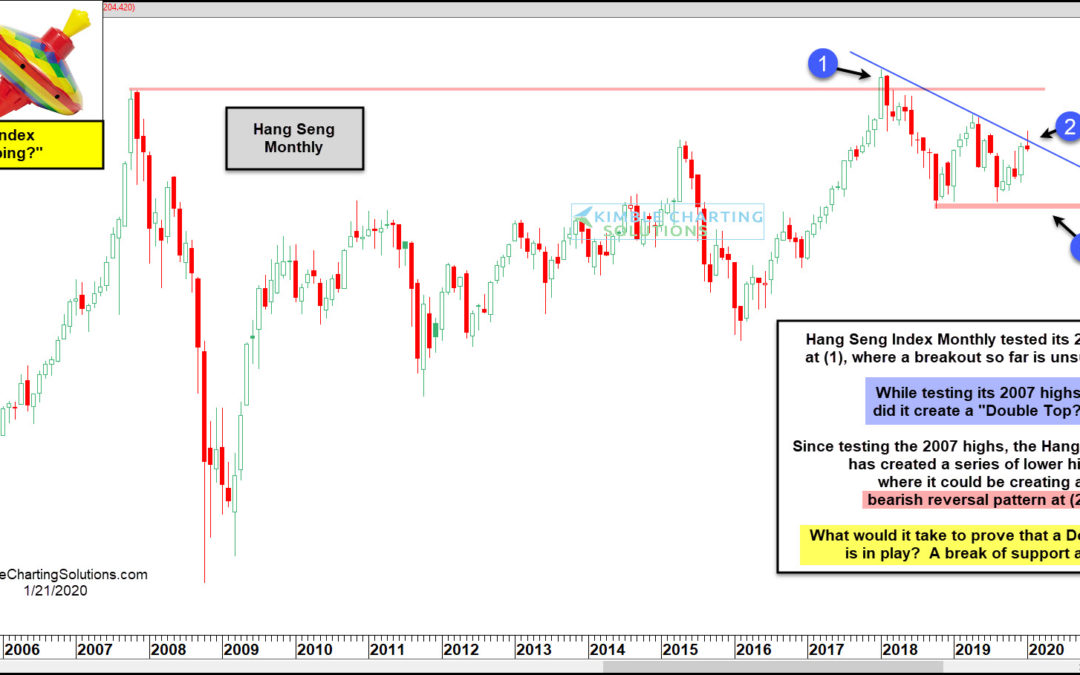
by Chris Kimble | Jan 21, 2020 | Kimble Charting
Could the Hang Seng Index be “Double Topping” at its 2007 highs? Possible, yet not proven! The Hang Seng Index attempted to break above its 2007 highs at (1), only to see a key reversal pattern take place the following month. After the reversal pattern,...
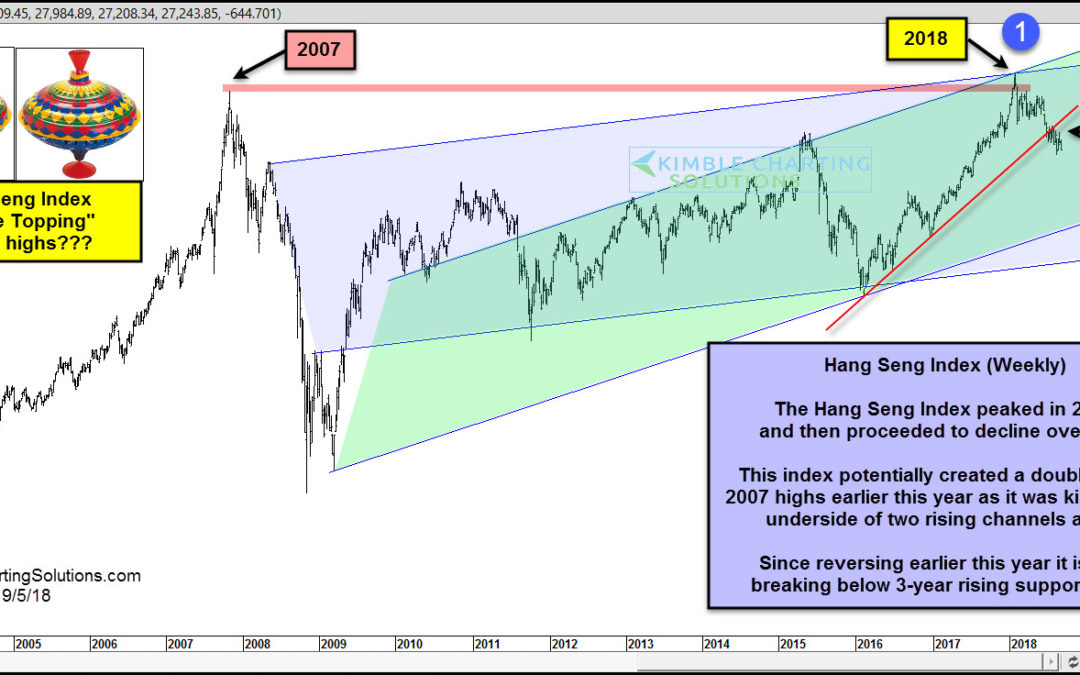
by Chris Kimble | Sep 5, 2018 | Kimble Charting
CLICK ON CHART TO ENLARGE Did the Hang Seng Index just create a “Double Top” at the same price it peaked in 2007? Let’s investigate! This chart looks at the Hang Seng Index on a weekly basis over the past 15-years. As you can see it peaked in 2007...
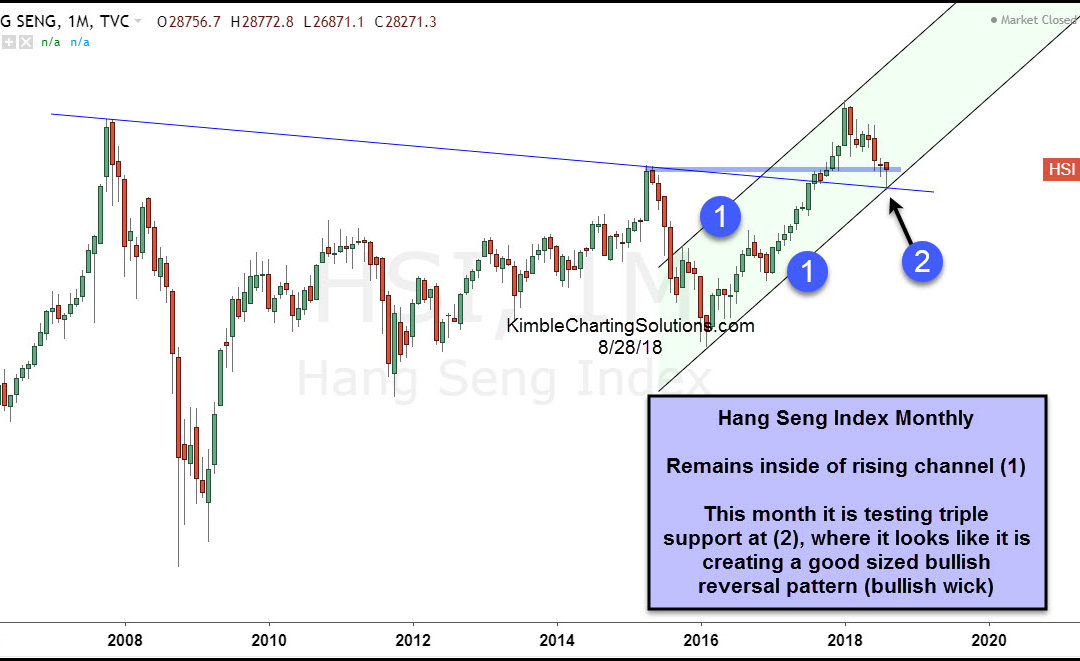
by Chris Kimble | Aug 29, 2018 | Kimble Charting
The hard-hit Chinese Hang Seng Index tested a big support level this month. Is this key Chinese stock market index ready to stage a rally here? Let’s take a look at today’s 2-pack of charts to see why the Hang Seng Index (and perhaps select emerging markets) could be...
