by Chris Kimble | Mar 13, 2014 | Kimble Charting
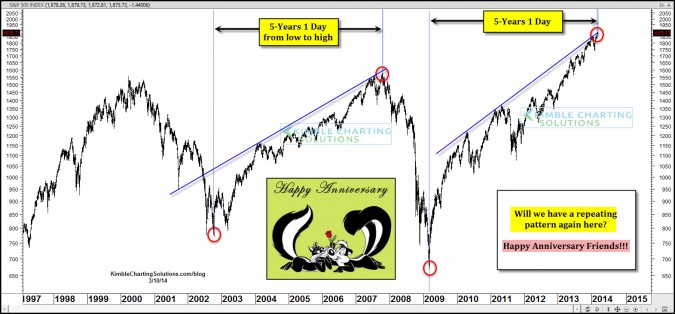
CLICK ON CHART TO ENLARGE The rally from the 2002 low to 2007 high, took 5 years! I sent the above chart to premium members earlier this week, as the 500 index was 5-years from its 2009 lows! Current rally last the “exact same time frame???”...
