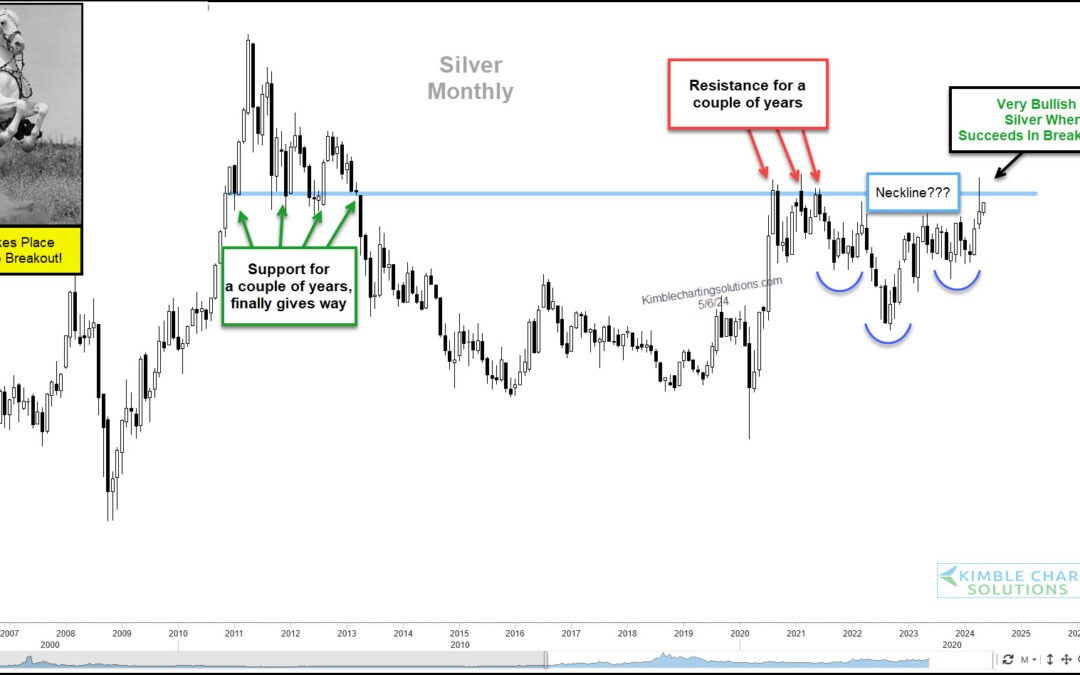
by Chris Kimble | May 8, 2024 | Kimble Charting
Precious metals have enjoyed a huge rally that has seen gold reach new all-time highs and silver reach new multi-year highs. There are a lot of tailwinds working for gold and silver today… global warfare, geopolitical instability, and inflation. Today we look at a...
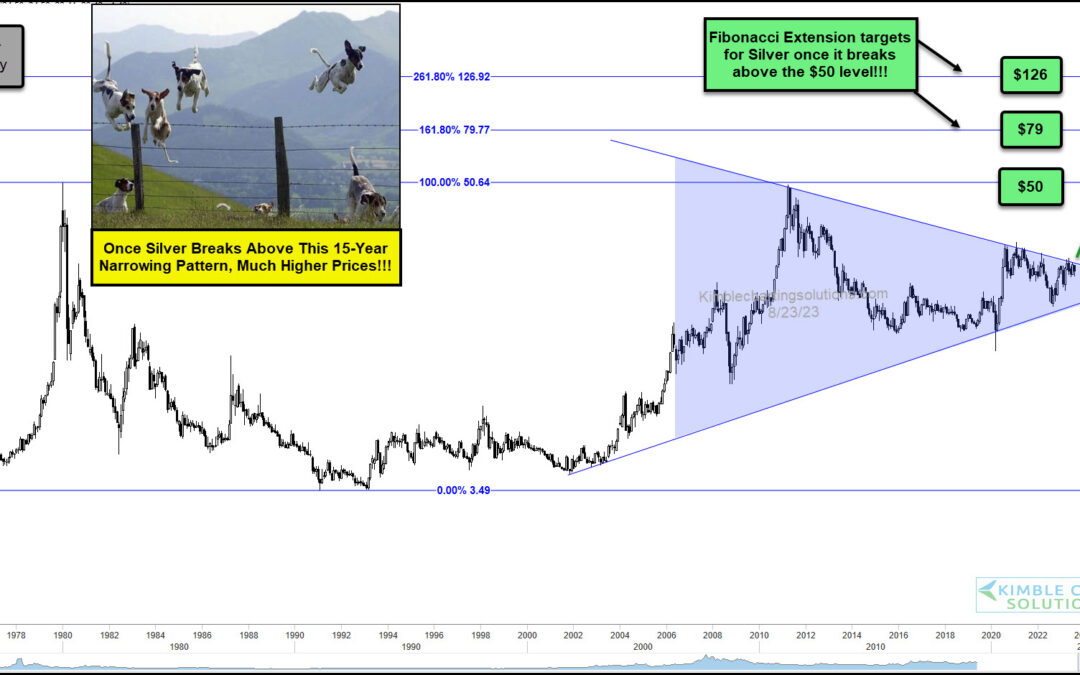
by Chris Kimble | Aug 24, 2023 | Kimble Charting
Precious metals have been a bit boring of late due to some sideways trading. BUT that boredom may come to an abrupt end shortly! Today’s chart takes a long-term view of Silver, highlighting a huge price pattern along with potential upside targets (if triggered). As...
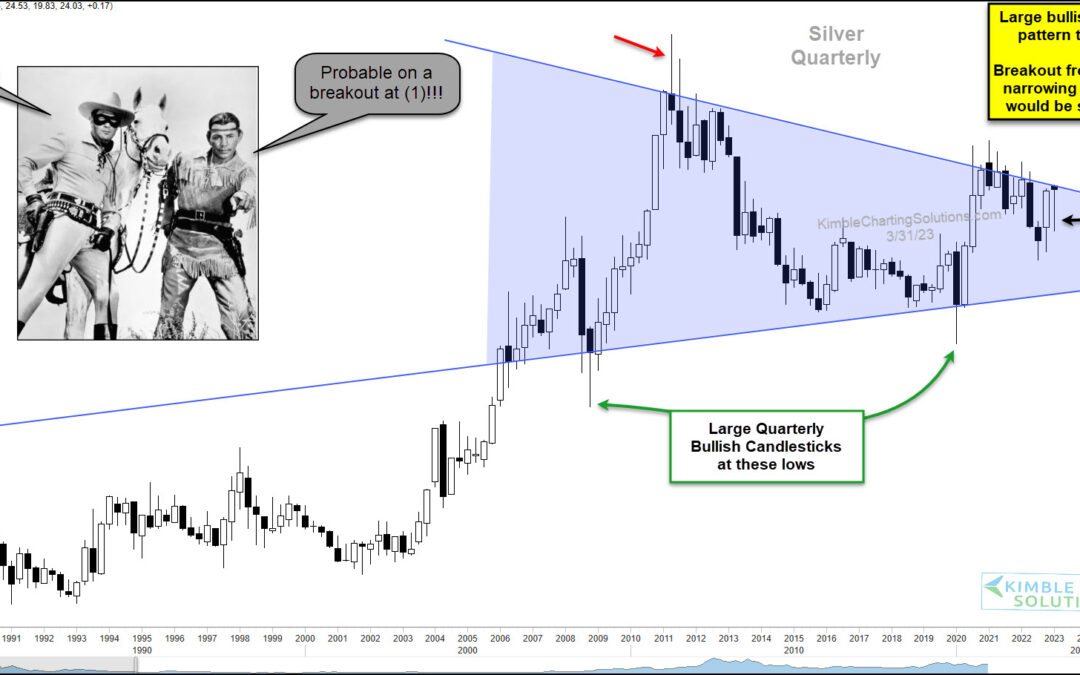
by Chris Kimble | Apr 3, 2023 | Kimble Charting
Precious metals bulls rose sharply last summer into the heart of inflation headlines and Ukraine war news. Since that time, both gold and silver have moderated but remained elevated in a consolidation pattern. But recent price action in Silver could be a bullish...
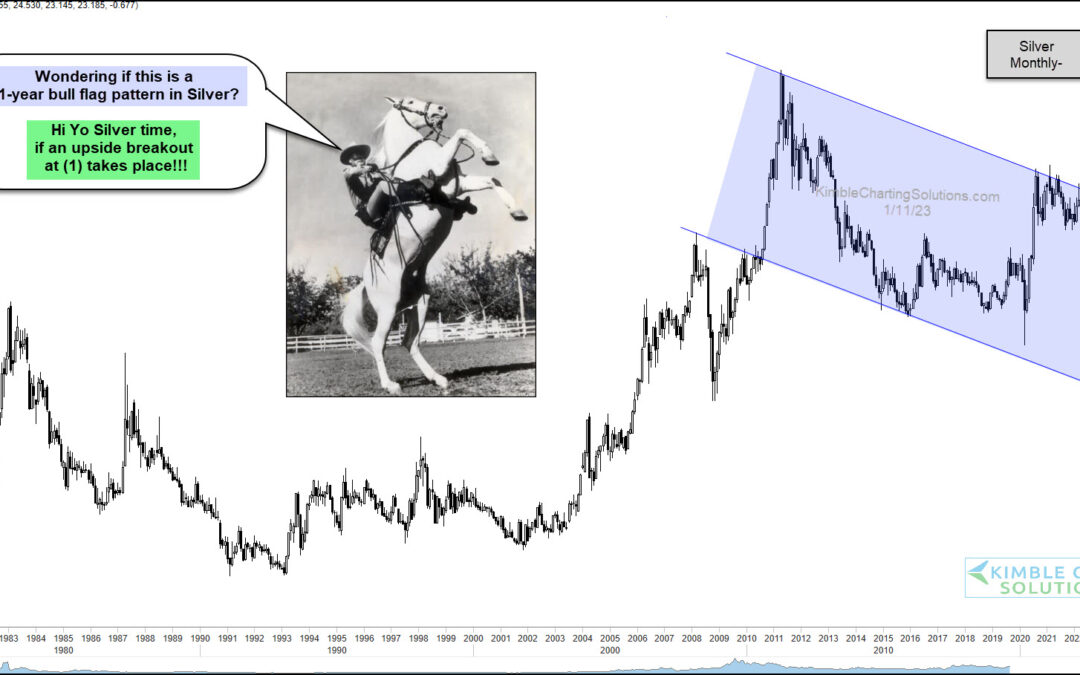
by Chris Kimble | Jan 11, 2023 | Kimble Charting
Silver prices have been moving higher for several months now and appear poised to test major breakout resistance. Could the reward for Silver bulls be a massive breakout higher? This is possible when one considers the mother of all bull flag patterns that has formed...
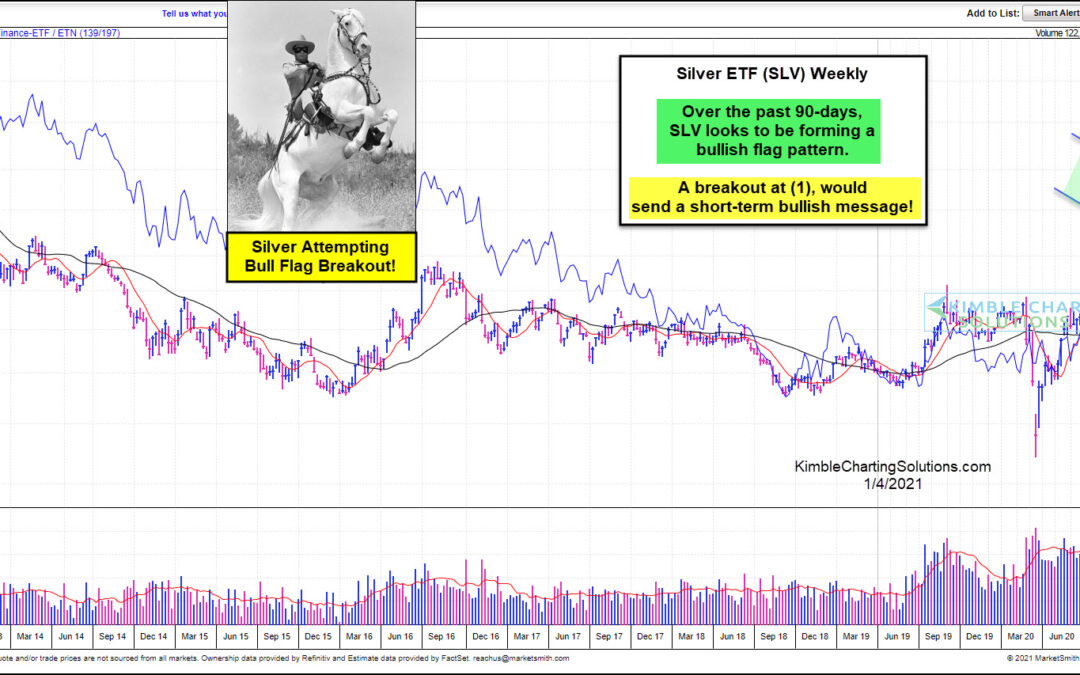
by Chris Kimble | Jan 4, 2021 | Kimble Charting
Is a Hi-Yo Silver bullish message about to take place in the short-term? This chart from Marketsmith.com suggests that a breakout attempt from a bull flag pattern is being attempted. Since peaking in August of 2020, Silver ETF (SLV) has created a series of lower...
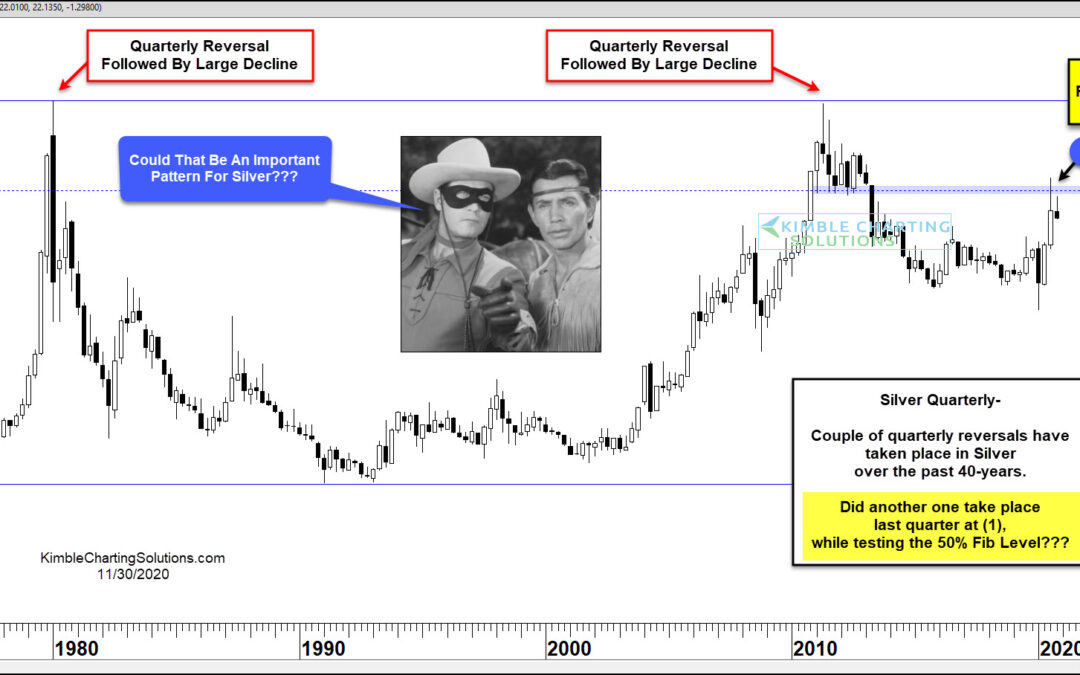
by Chris Kimble | Nov 30, 2020 | Kimble Charting
Precious metals caught lightning in a bottle for the first 7 months of the year, with Gold notching new all-time highs and Silver making to multi-year highs in August. But both have reversed lower since peaking in August and investors should pay attention. It might be...
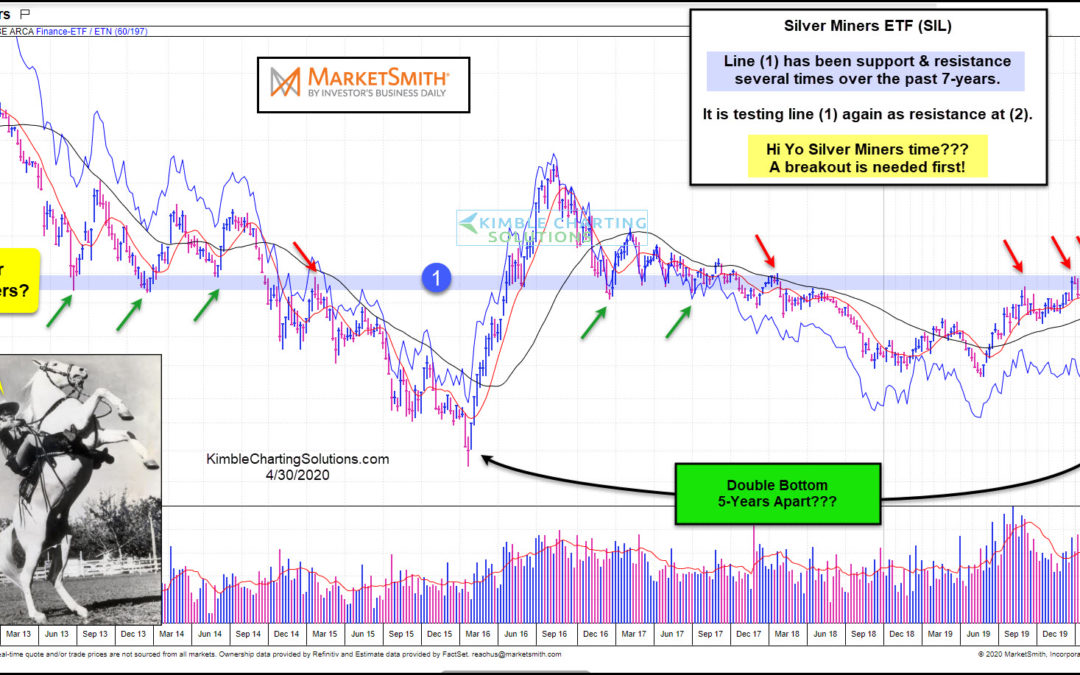
by Chris Kimble | Apr 30, 2020 | Kimble Charting
It is Hi-Yo Silver Miners Time for miners? We could find out real soon, as Silver Miners ETF (SIL) is testing a key breakout level. The sharp decline in March saw SIL test the 2015 lows, creating the potential for a long-term double bottom. This chart from...
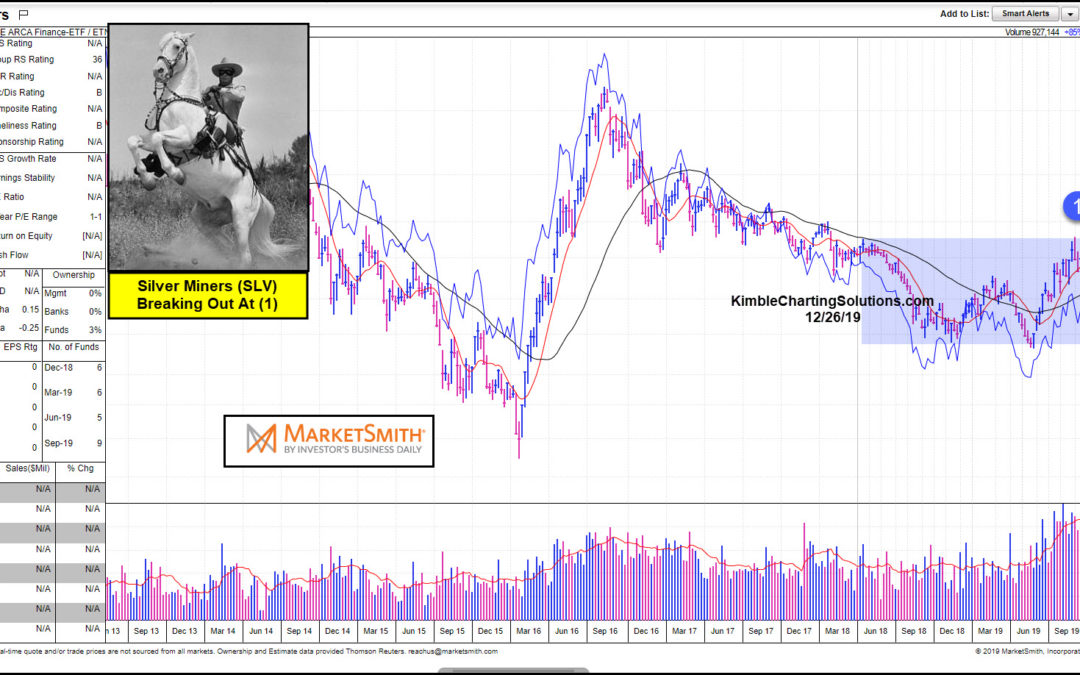
by Chris Kimble | Dec 26, 2019 | Kimble Charting
Is it Hi-Yo Silver time for Silver Minning stocks? Could be! This chart from Marketsmith.com reflects that Silver Miners ETF (SIL) is working on a breakout of an 18-month trading range at (1). As the breakout is taking place, relative strength is attempting to turn...
