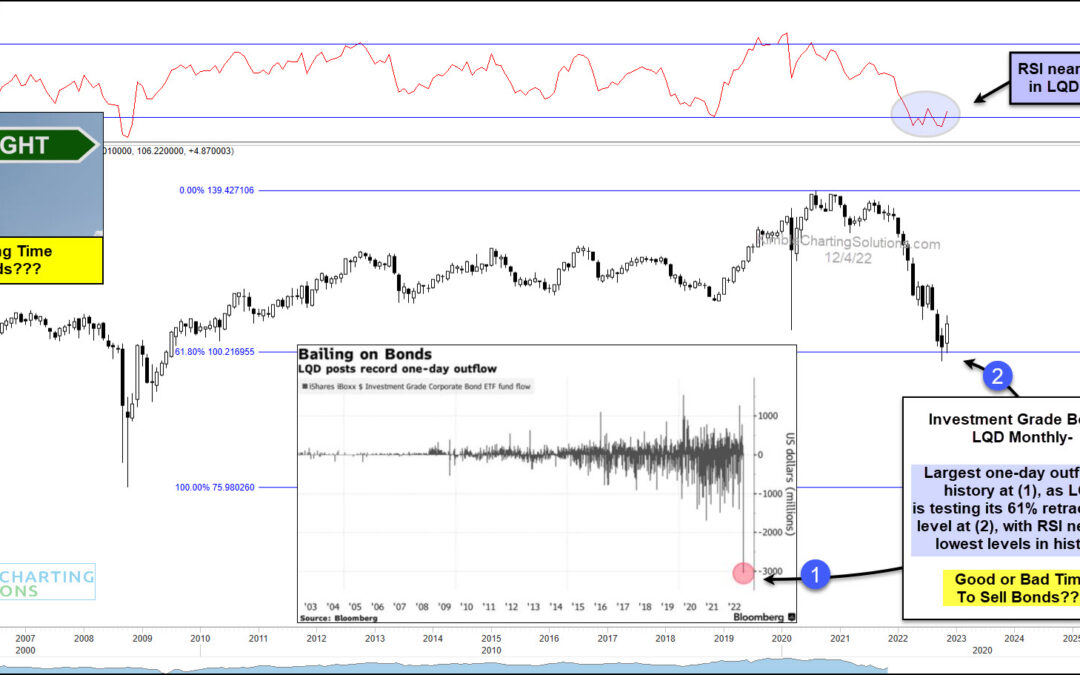
by Chris Kimble | Dec 6, 2022 | Kimble Charting
Considering our national debt and the debts of companies and consumers, it’s obvious that the bond market is critical to our economy. This is likely why the Investment Grade Bond ETF (LQD) started to sputter last year, well before the bear market in stocks this year....

by Chris Kimble | Mar 18, 2020 | Kimble Charting
Boring Investment Grade bonds could be sending a very important macro message of late! This chart looks at Investment Grade ETF (LQD) on a weekly basis over the past 20-years. LQD formed a bottom in late 2008, several months ahead of stocks. Following the 2008 low,...
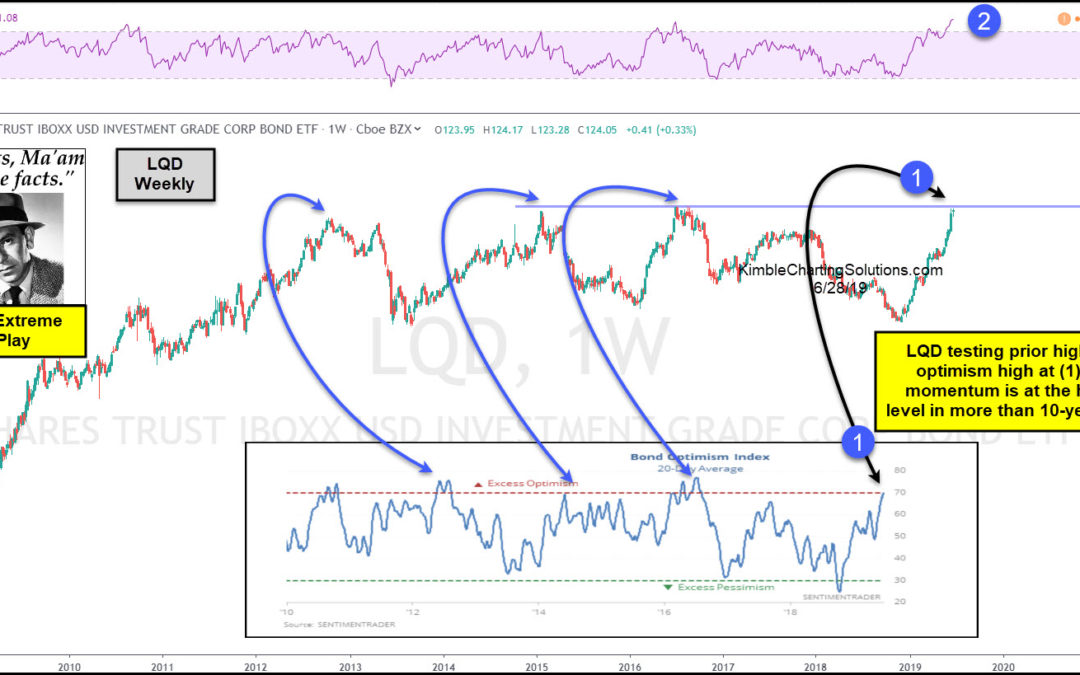
by Chris Kimble | Jun 28, 2019 | Kimble Charting
Are investment grade bonds peaking? Some conditions suggest its possible, says Joe Friday! This chart looks at Investment Grade Bond ETF (LQD) over the past 10-years. LQD has moved sharply higher since the lows in December of 2018. The rally has LQD testing its 2015...
by Chris Kimble | Dec 20, 2011 | Kimble Charting
The “Power of the Pattern” reflected in the chart below that for those bond investors that liked to buy on support a good opportunity was at hand. (see post here) CLICK ON CHART TO ENLARGE Below is an update on the price movement of LQD over the past...

by Chris Kimble | Nov 29, 2011 | Kimble Charting
CLICK ON CHART TO ENLARGE If you like to buy at support, LQD is presenting an opportunity, as it is closing in on a support line that has been in place since 2009. As shared in the chart, if you are long equities you should respect what happend at (2)...
by Chris Kimble | Oct 7, 2011 | Kimble Charting
CLICK ON CHART TO ENLARGE Hot bonds….Govt. Bonds/TLT Cold Bonds…High yields Hot bonds turning Cold…The above bond 3-pack reflects some bonds that have been hot, that are either on support or breaking very steep rising support...
by Chris Kimble | Jan 24, 2011 | Kimble Charting
CLICK ON CHART TO ENLARGE Have been a fan of the price action of high yields for months. Price action in the high yield fund complex remains a positive. TLT and MUB have had a rough go of it recently. Buy low/Sell high something to consider in these...
by Chris Kimble | Jan 13, 2011 | Kimble Charting
A month ago, the “Power of the Pattern” suggested that investors should buy LQD due to the formation of a falling wedge at support after a sizeable decline. (see post here) CLICK ON CHART TO ENLARGE Below is an update to this position. CLICK ON...
