by Chris Kimble | Dec 13, 2023 | Kimble Charting
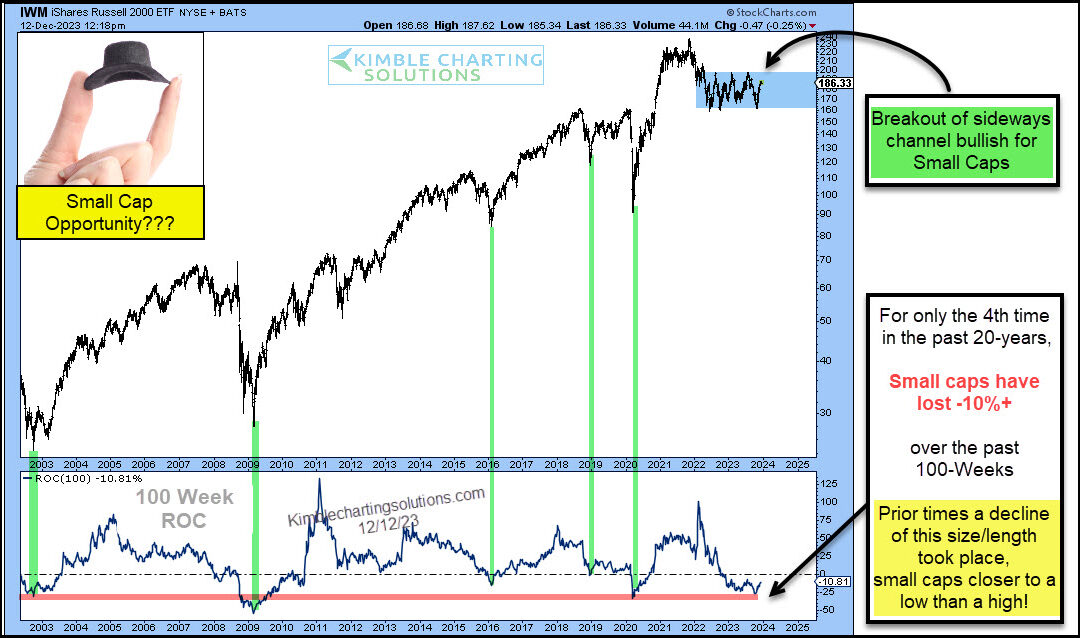
It is no secret that small-cap stocks have been out of favor. And underperforming! BUT lately, small-cap stocks have been in rally mode. So is there any reason for the recent buying? And could this continue? Today we look at a “weekly” chart of the Russell 2000 ETF...
by Chris Kimble | Oct 31, 2023 | Kimble Charting
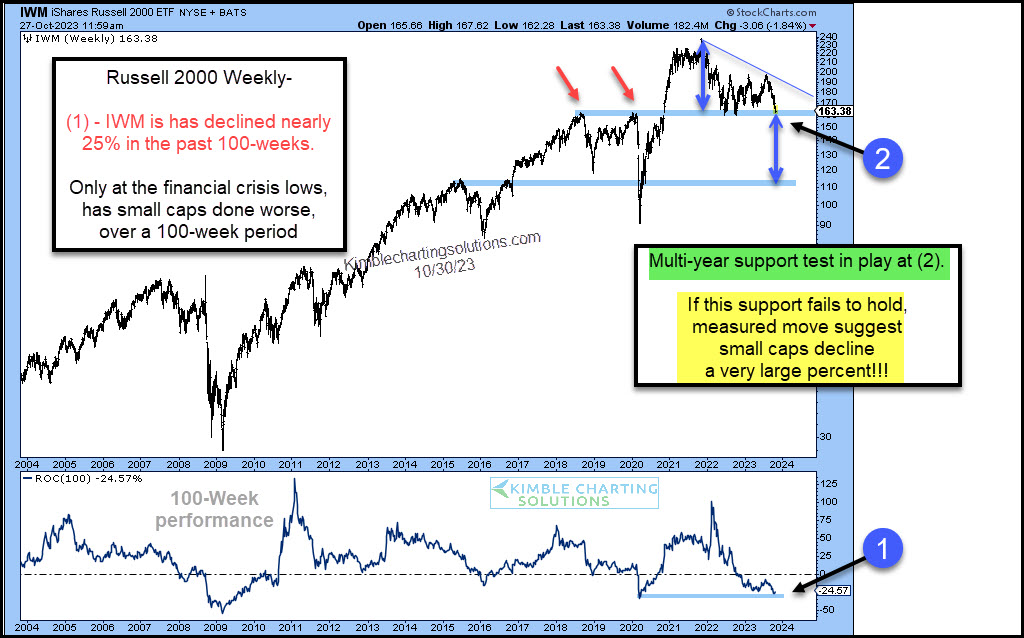
It’s been a dreadful past couple of years for the Russell 2000 and small cap stocks. Only in 2009 have small caps performed worse over a 100-week period – point (1) on today’s chart. Above we look at a long-term “weekly” chart to highlight some important technical...
by Chris Kimble | Oct 6, 2022 | Kimble Charting
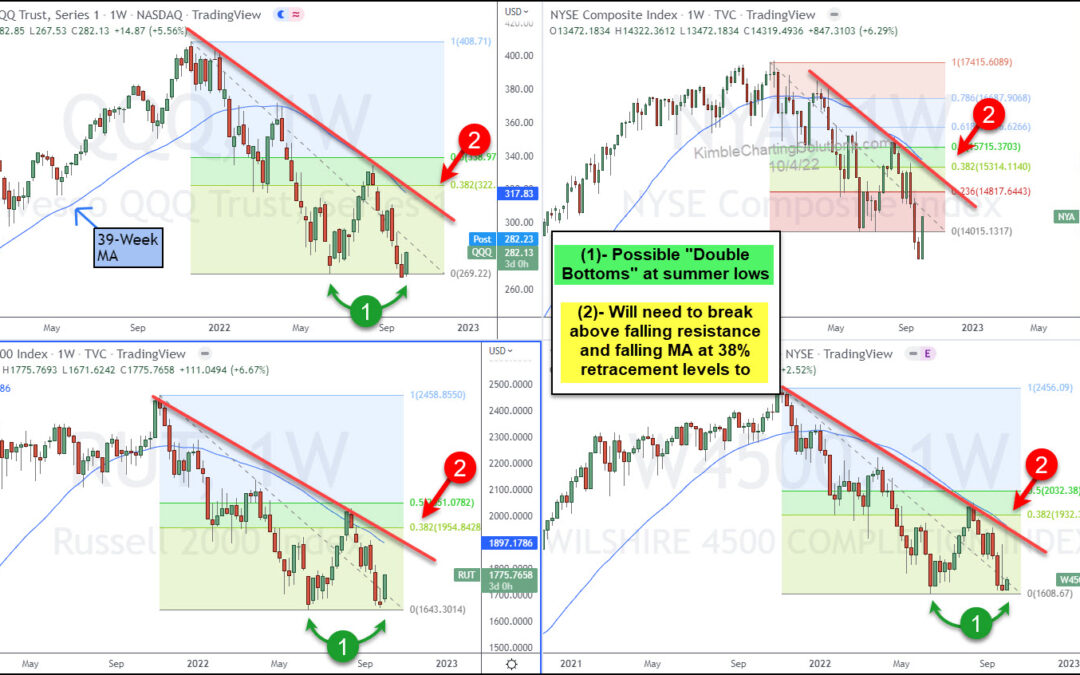
With stock markets in deep declines, traders need to stay cautious and adhere to their plans. As the same time, it is smart to identify potential technical patterns and what if scenarios to help identify potential trend changes. Today, we look at a chart 4-pack to...
by Chris Kimble | Aug 11, 2022 | Kimble Charting
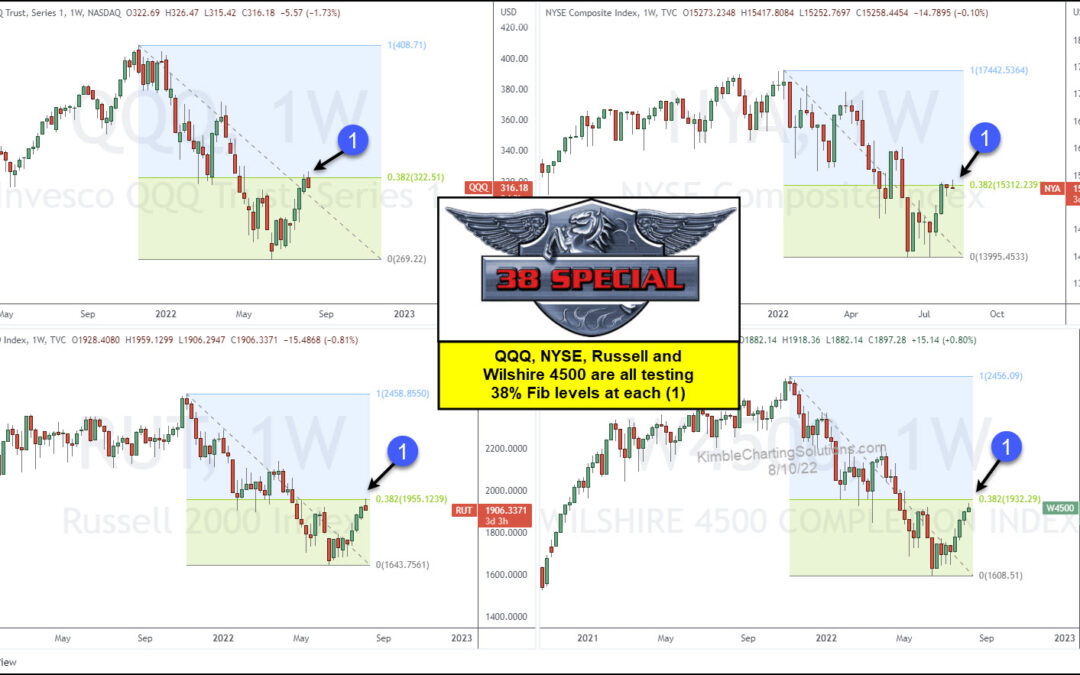
As the stock market bounce continues, wary investors are beginning to wonder about how much longer this rally will last. While no one can predict the future, we can utilize technical tools to gauge the rally’s health. Today we highlight a key Fibonacci...
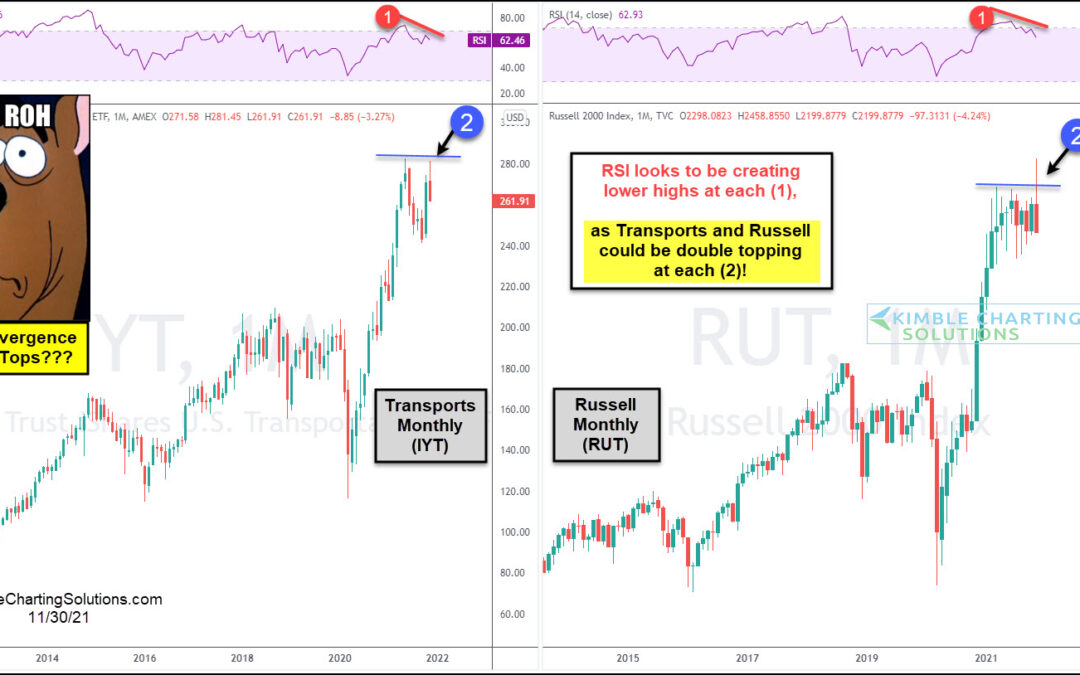
by Chris Kimble | Dec 2, 2021 | Kimble Charting
Uncertainty is mounting as the new omicron covid variant adds to economic concerns like inflation. This week, I shared an article looking at potential topping formations on the Transportation Sector (IYT) and small-cap Russell 2000 Index (IWM). Here we revisit these...
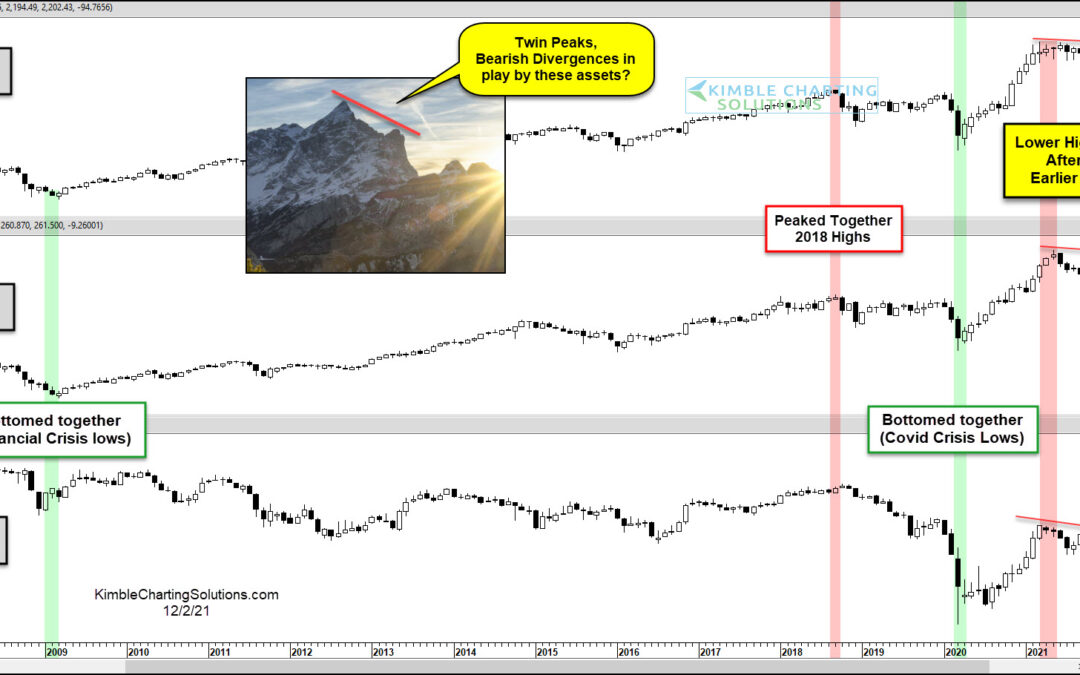
by Chris Kimble | Dec 1, 2021 | Kimble Charting
Two extremely important sectors to the economy and U.S. equities market are struggling. And investors should take notice. The Transportation Sector ETF (IYT) small cap Russell 2000 (IWM) are two sectors bulls would like to see continuing higher. But today’s long-term...
by Chris Kimble | Nov 25, 2019 | Kimble Charting
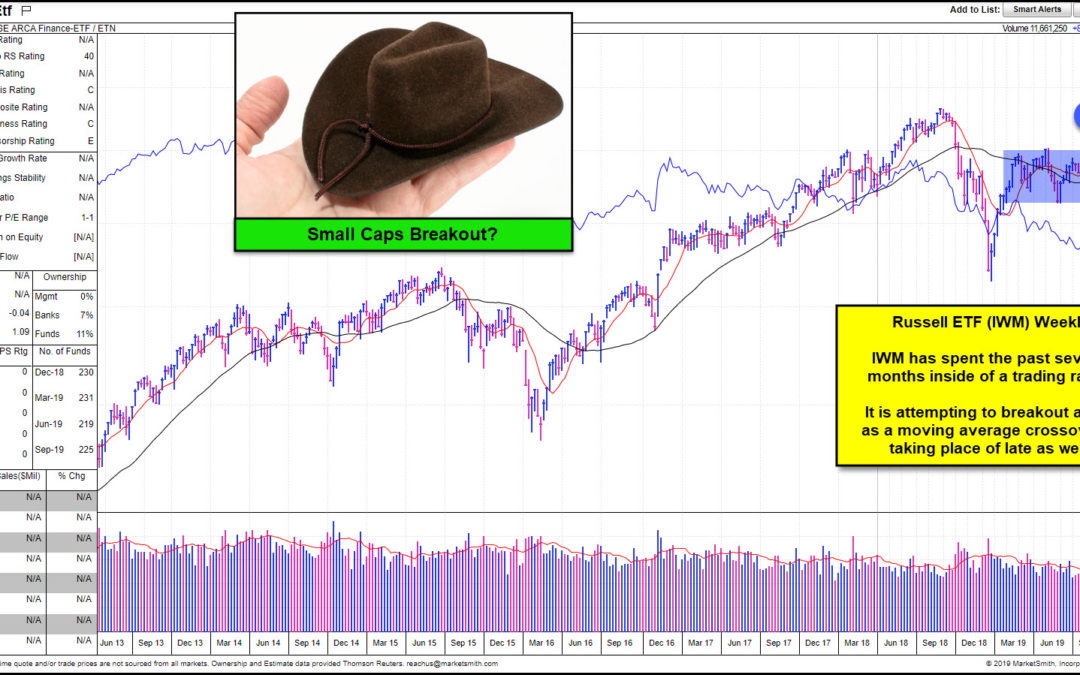
Small Caps (Russell 2000) have lagged large caps for nearly 18-months? Is it time for them to start outperforming large caps? What they do at (1) will send an important signal! The Russell ETF (IWM) has traded sideways for the past 6-months, inside of the blue shaded...
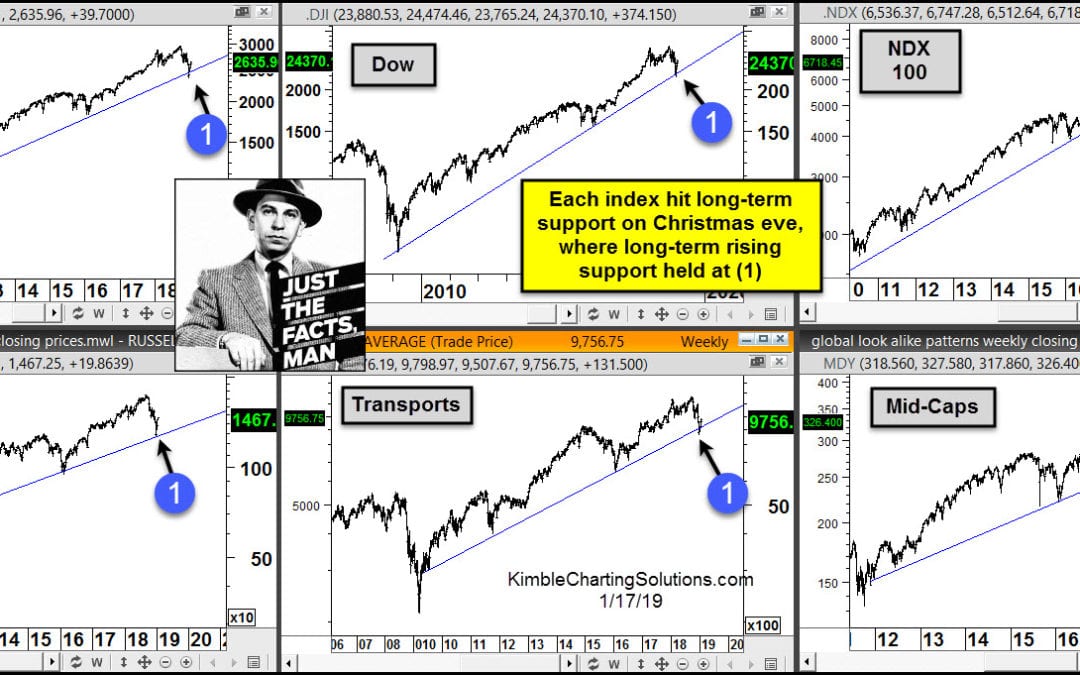
by Chris Kimble | Jan 18, 2019 | Kimble Charting
We often hear “Stocks take an escalator up and an elevator down!” No doubt stocks did experience a swift decline from the September highs to the Christmas eve lows. Looks like the “elevator” part of the phrase came true as 2018 was coming to an...
