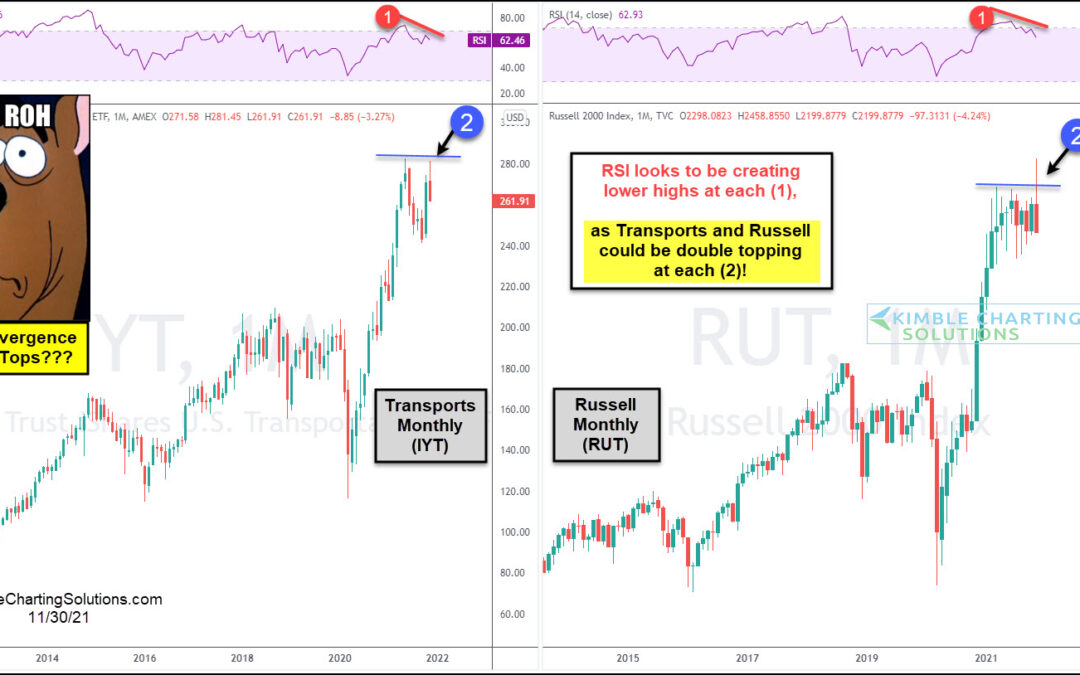
by Chris Kimble | Dec 1, 2021 | Kimble Charting
Two extremely important sectors to the economy and U.S. equities market are struggling. And investors should take notice. The Transportation Sector ETF (IYT) small cap Russell 2000 (IWM) are two sectors bulls would like to see continuing higher. But today’s long-term...
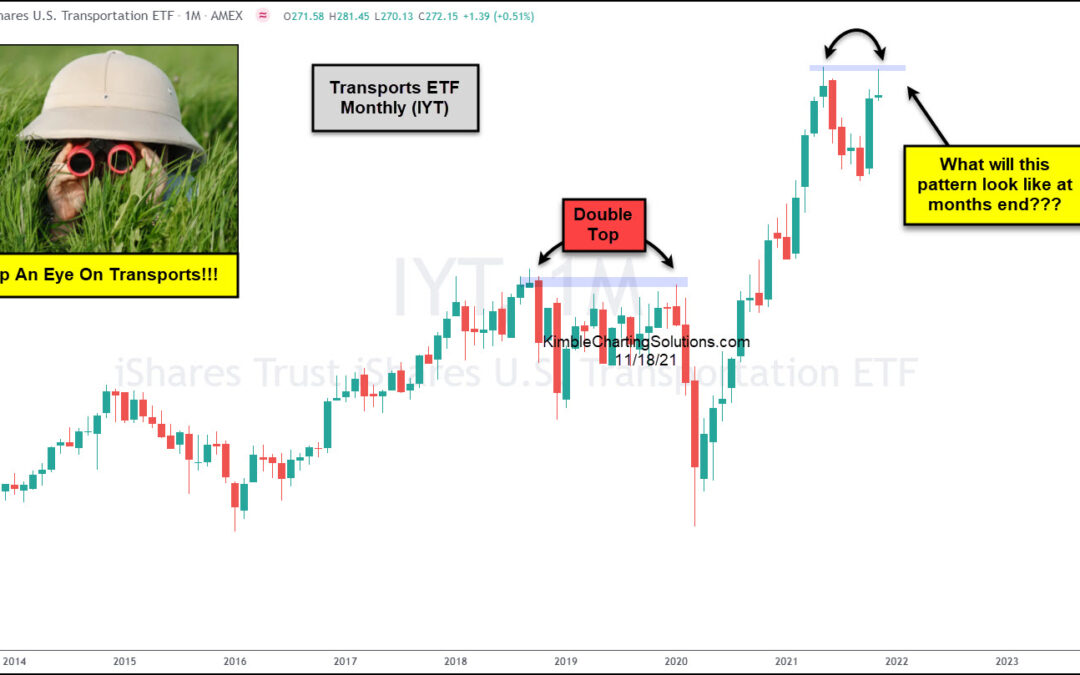
by Chris Kimble | Nov 19, 2021 | Kimble Charting
As the bull market carries on into year-end, some lagging sectors and stocks are just getting back to their early 2021 highs. Some will breakout (bullish), while some will find stronger resistance and pullback. For the latter, a move lower may raise the prospect of a...
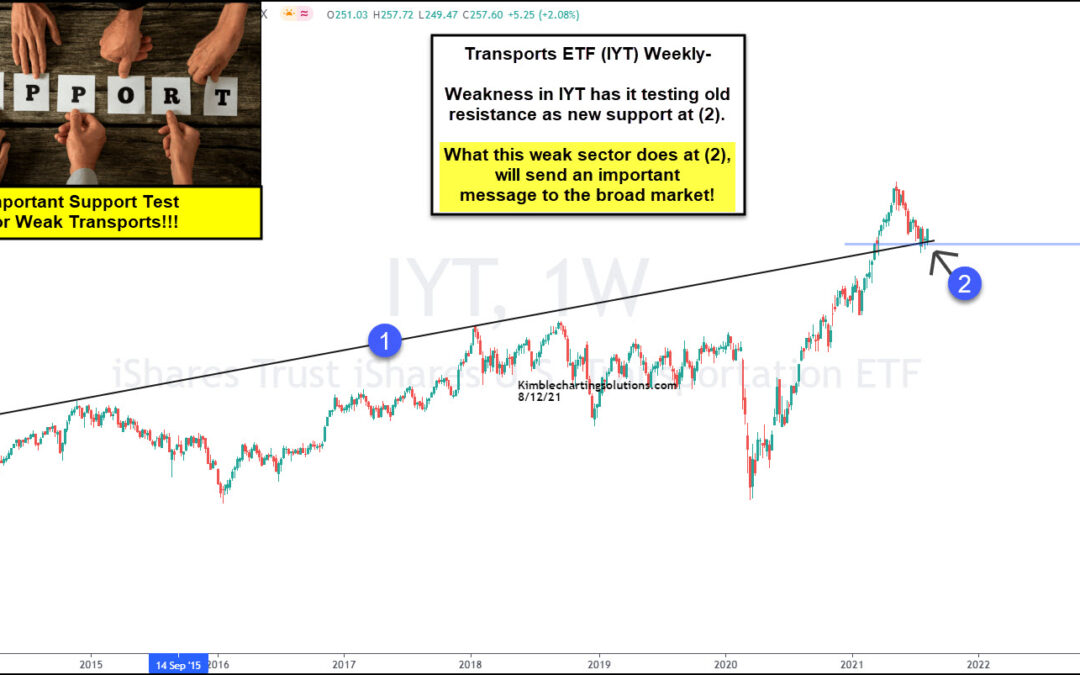
by Chris Kimble | Aug 12, 2021 | Kimble Charting
After a meteoric rise out of the 2020 coronavirus crash lows, the Transportation Sector ETF (IYT) has stumbled and bumbled. Better said, the Transports have been a major laggard of the broader market. As you know, the transportation sector is a key cog in the economy...
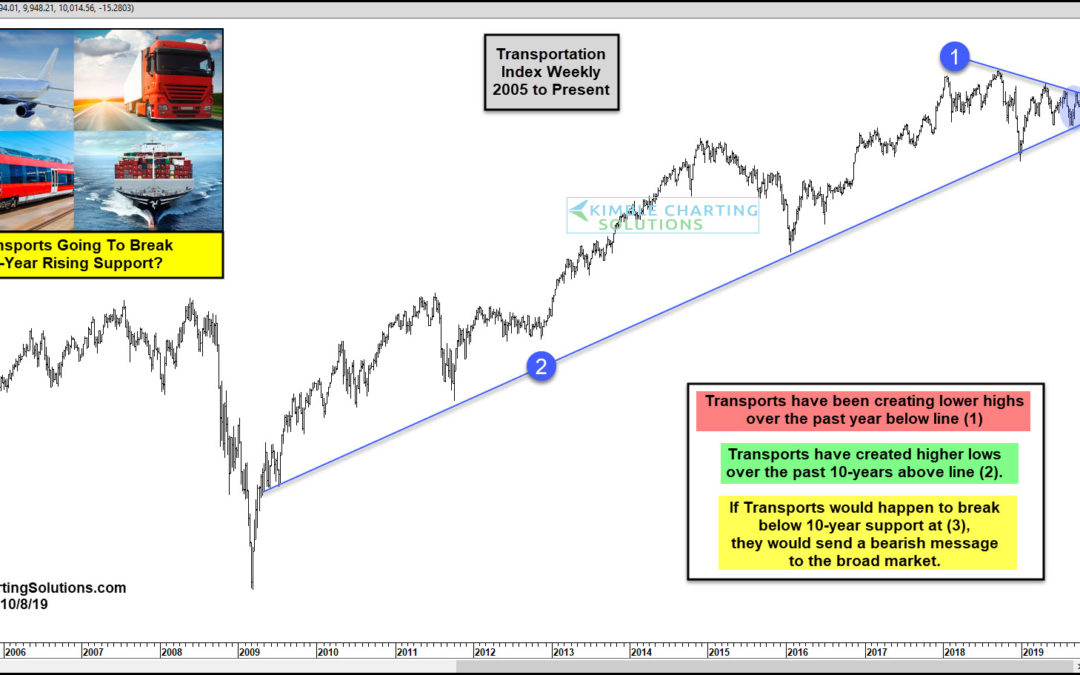
by Chris Kimble | Oct 8, 2019 | Kimble Charting
Transports have been flying high for nearly a decade. Is this trend about to end? This chart looks at the Dow Jones Transportation Index over the past 14 years. Since the summer of 2009, they have been creating a series of higher highs along line (2). Over the past...
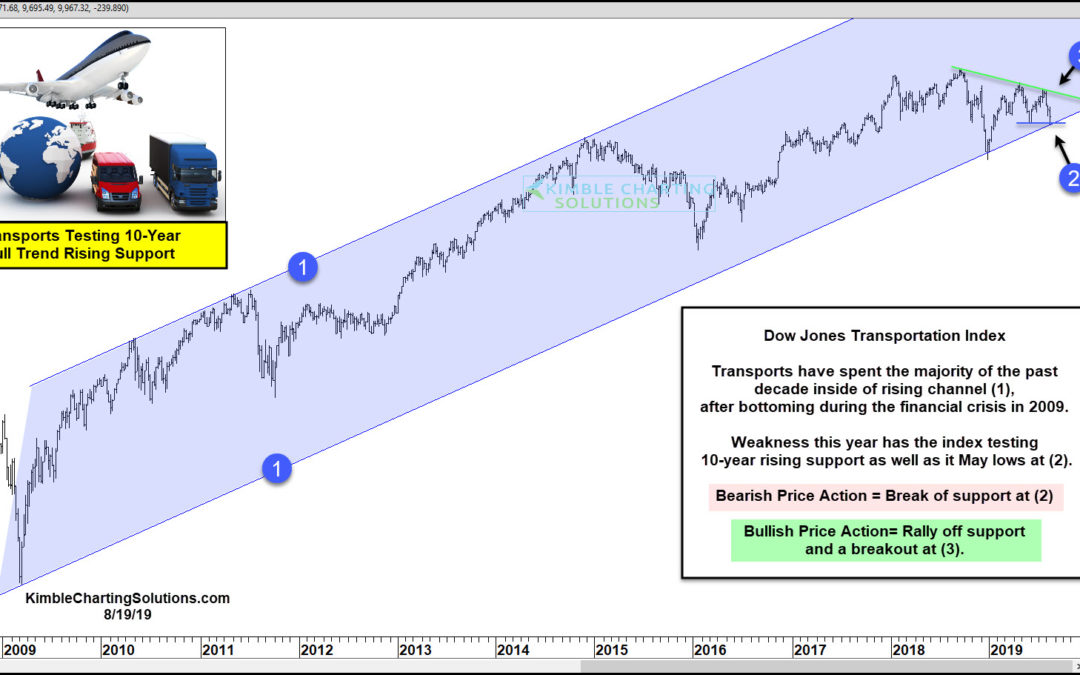
by Chris Kimble | Aug 19, 2019 | Kimble Charting
Is the DJ Transportation Index presenting a rare buying opportunity? The broad market most likely hopes so! Transports have spent the majority of the past decade creating a series of higher lows. This pattern has created rising channel (1), which started back in 2009....
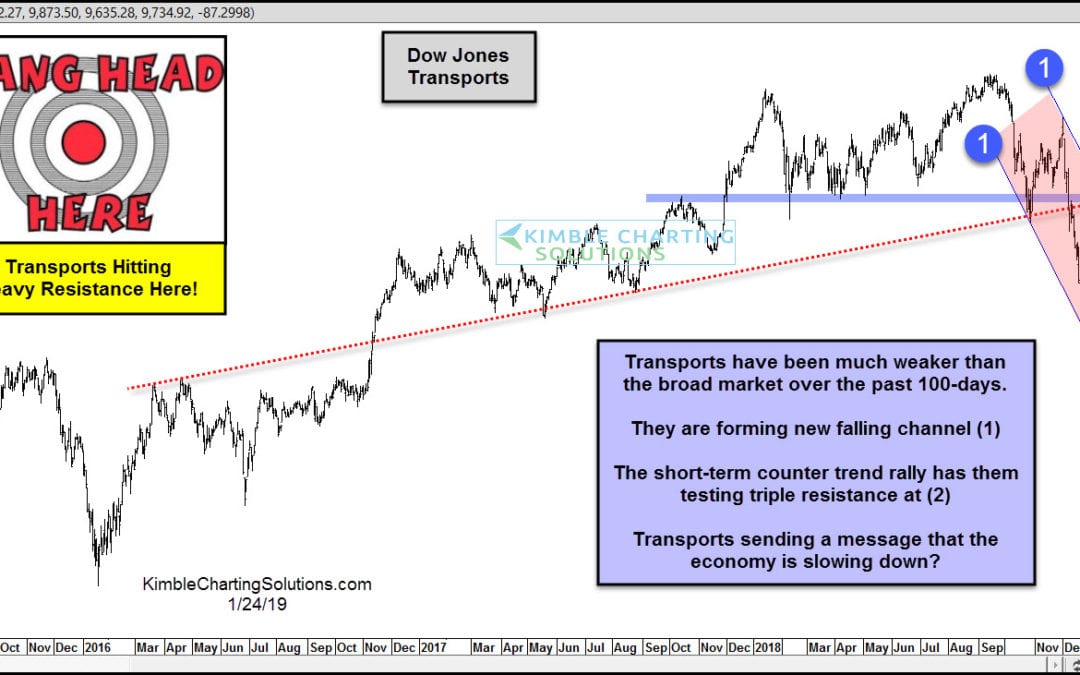
by Chris Kimble | Jan 24, 2019 | Kimble Charting
Transports are often considered a leading indicator of how the economy is doing. Since the Septemeber 2018 highs, the Dow Jones Transports Index has declined more than the broad market. This decline looks to be forming a new falling channel highlighted at (1). The...
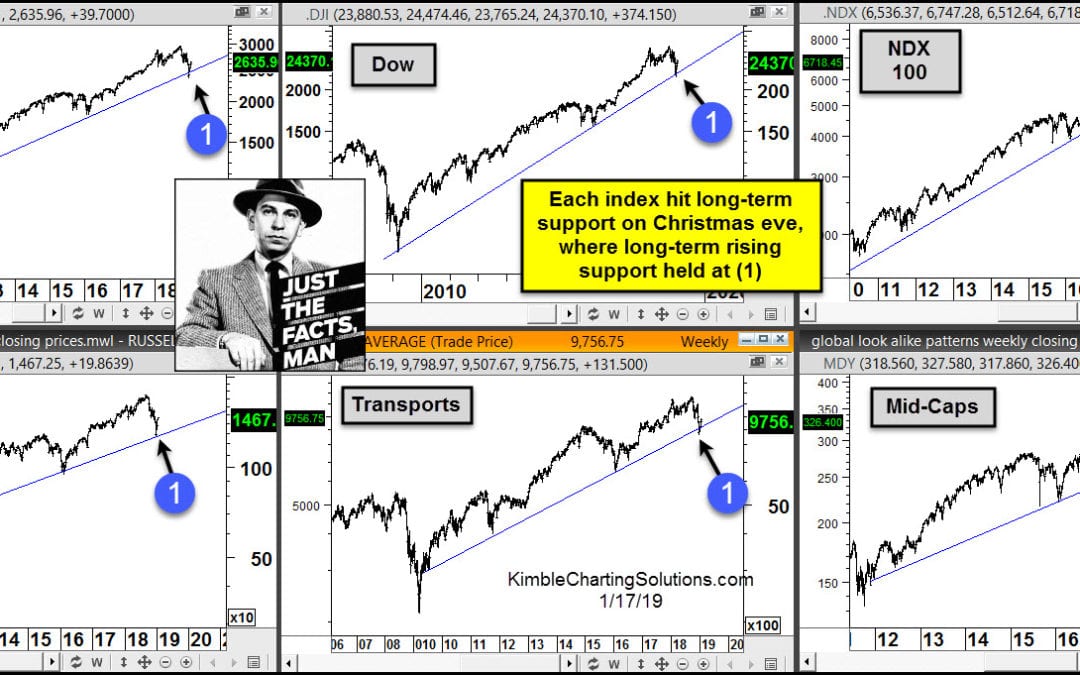
by Chris Kimble | Jan 18, 2019 | Kimble Charting
We often hear “Stocks take an escalator up and an elevator down!” No doubt stocks did experience a swift decline from the September highs to the Christmas eve lows. Looks like the “elevator” part of the phrase came true as 2018 was coming to an...
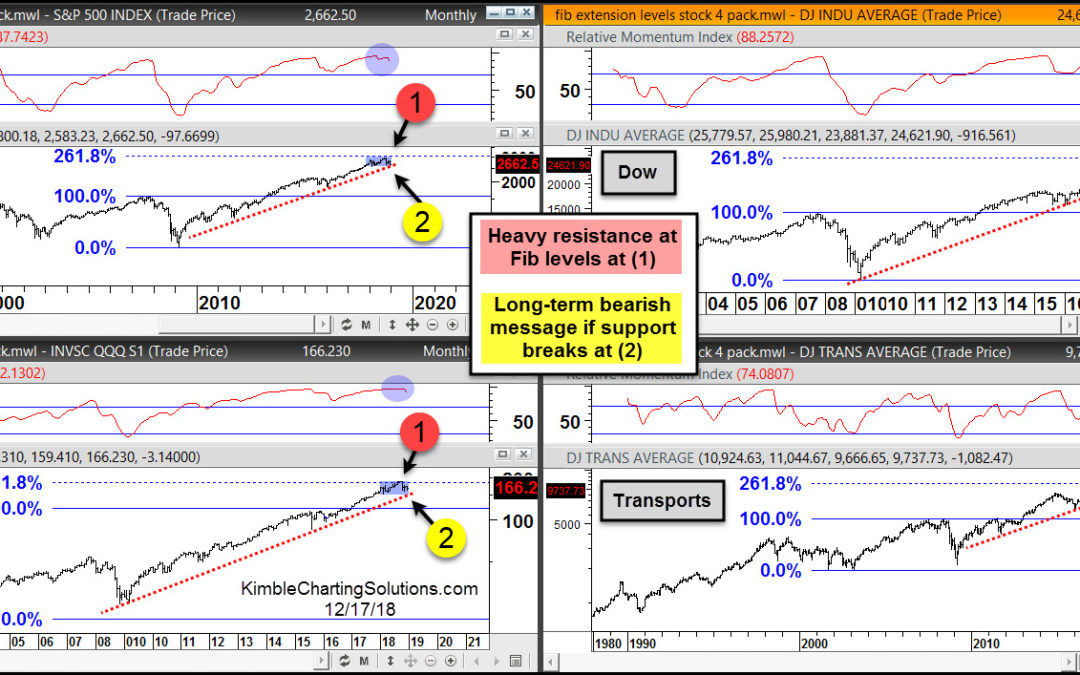
by Chris Kimble | Dec 17, 2018 | Kimble Charting
Even though stocks have been weak of late, breaks of certain price levels could actually trigger much more selling than stocks have seen so far. This 4-pack applies Fibonacci extension levels to the S&P 500, Dow, Nasdaq 100 and Transports. Each of these indices...
