by Chris Kimble | Feb 16, 2011 | Kimble Charting
CLICK ON CHART TO ENLARGE For the first time since the Tech bubble back in 2000, the NDX is 3% above its 38% retracement level at (1) in the above chart. From a Fib retracement perspective, the next key resistance level comes into play around 2,750. NDX 100 is...

by Chris Kimble | Feb 14, 2011 | Kimble Charting
Patterns suggested over a month ago to “Buy the Mid-Caps” on a breakout. See pattern suggestion on 1/11 (see post here) Below is an update on the MDY ETF. CLICK ON CHART TO ENLARGE CLICK ON CHART TO ENLARGE Game Plan…Continue...

by Chris Kimble | Feb 9, 2011 | Kimble Charting
In the chart below, I highlighted that the Dow was breaking above key resistance line (1) for only the 2nd time in its history at (3). (see post here) CLICK ON CHART TO ENLARGE Game plan at that time was to BUY THE DOW, due to the...

by Chris Kimble | Feb 4, 2011 | Kimble Charting
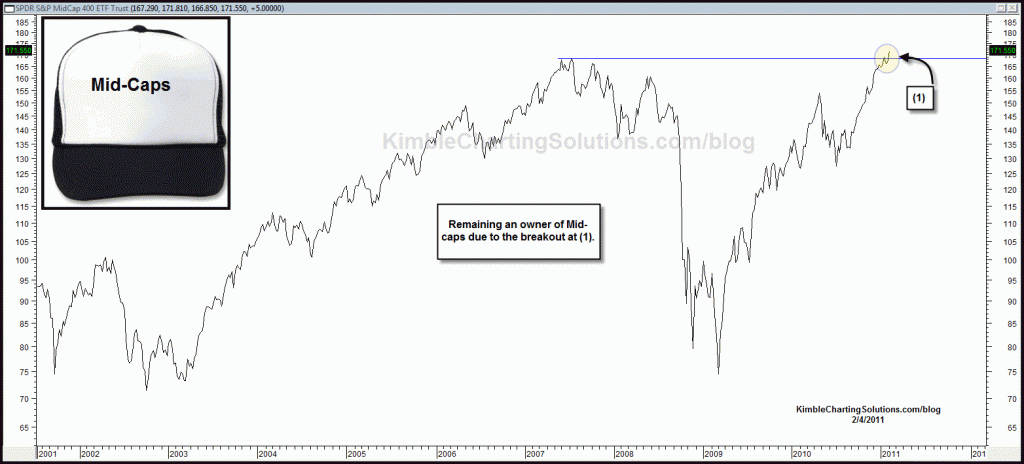
CLICK ON CHART TO ENLARGE Game Plan…Own and continue to like the progress Mid-Cap ETF MDY is making at (1) in the chart above.

by Chris Kimble | Feb 1, 2011 | Kimble Charting
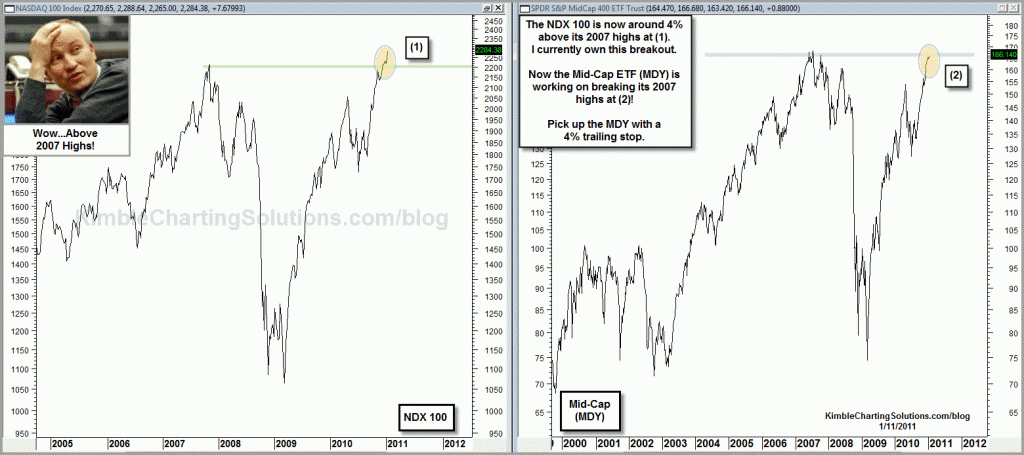
Posted the chart below on 1/11, reflecting an NDX breakout (see post here). Suggested to own the NDX and Mid-caps with stops. CLICK ON CHART TO ENLARGE Below is an update to the above chart, reflecting that the NDX is pushing higher above the breakout....

by Chris Kimble | Jan 11, 2011 | Kimble Charting
CLICK ON CHART TO ENLARGE Quality relative strength took place yesterday in the Semicondutor ETF (XSD) as it gained over 1%. In the past, relative strength in the Semi sector was usually good for the broad market. The NDX 100 continues to create some space above...

by Chris Kimble | Oct 21, 2010 | Kimble Charting
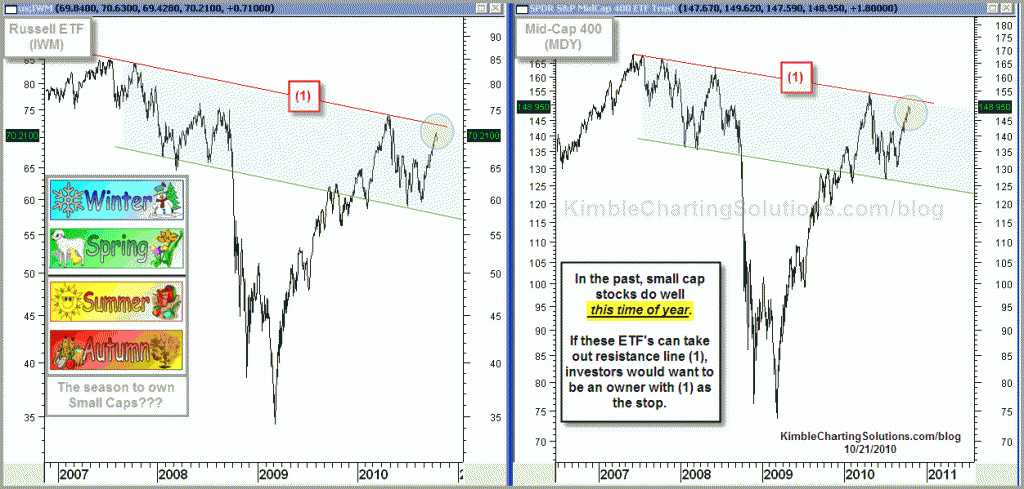
Some say that Small caps do well/outperform at the end of the year and the beginning of a new year. Whether this is true this year or not, the pattern in the small caps below should be watched closely. CLICK ON CHART TO ENLARGE Small cap ETF’s are facing...


