by Chris Kimble | Mar 5, 2018 | Kimble Charting
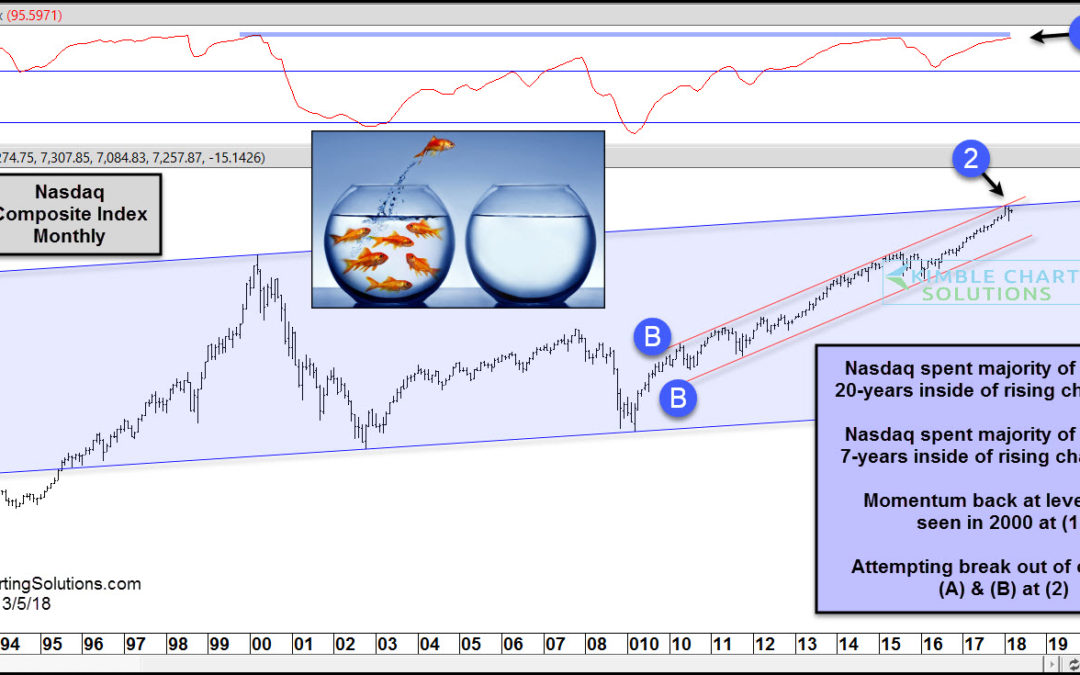
CLICK ON CHART TO ENLARGE The chart above looks at the Nasdaq Composite Index over the past 27-years, on a monthly basis. The trend remains solidly up for tech, no doubt about it! The index has spent the majority of the past 20-years inside of rising channel (A) and...
