by Chris Kimble | Aug 18, 2023 | Kimble Charting
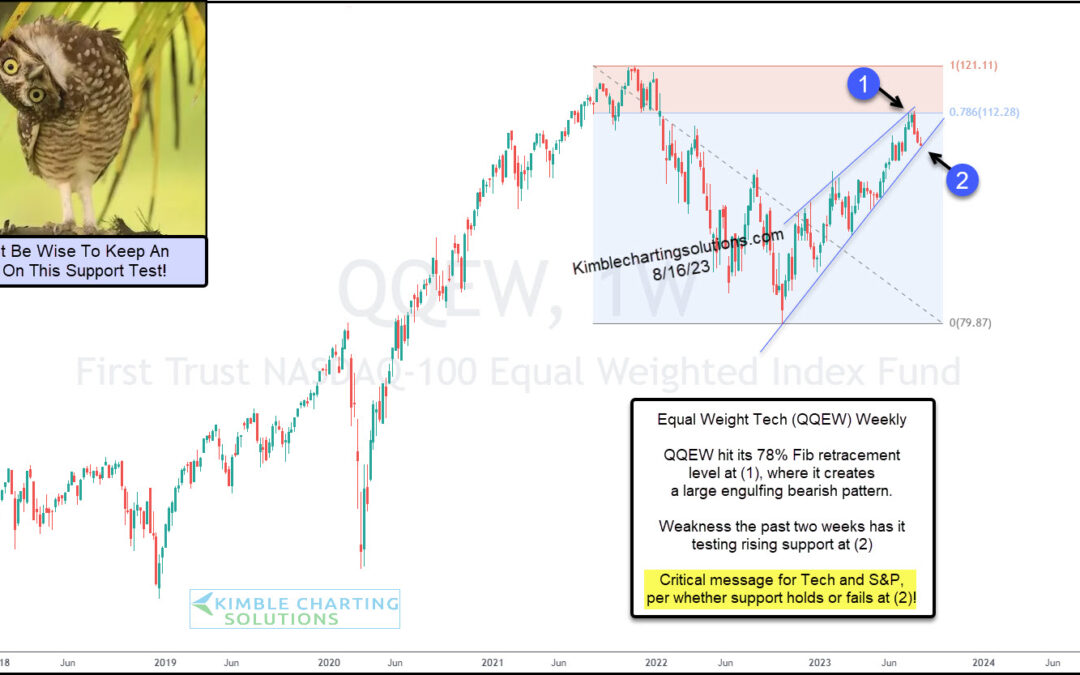
Tech stocks have been leaders once again in 2023 following its broad-based correction into 2022. BUT, we are not out of the woods just yet! Today’s chart looks at the Equal Weight Nasdaq 100 ETF (QQEW) and provides an insightful snapshot of the current state of large...
by Chris Kimble | Jan 27, 2023 | Kimble Charting
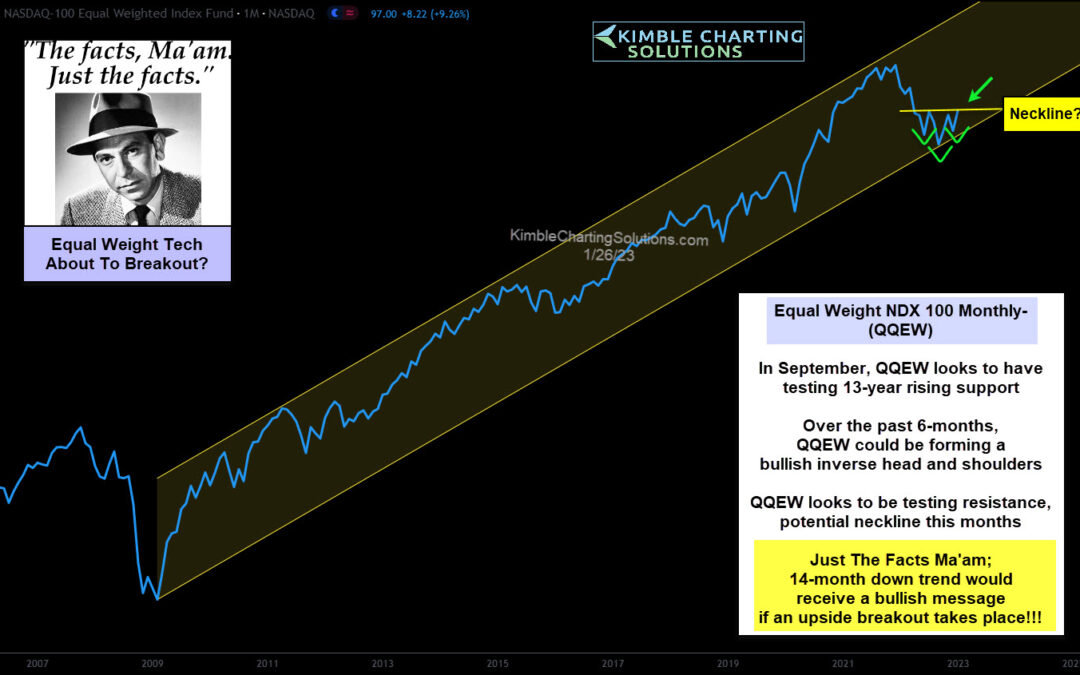
Investors are hoping that a strong January is just the start to a strong recovery for stock prices. Particularly, tech stock prices. The selloff hit tech stocks particularly hard as a slowing economy and inflation are strong headwinds for growth stocks. Investors hope...
by Chris Kimble | Sep 14, 2022 | Kimble Charting
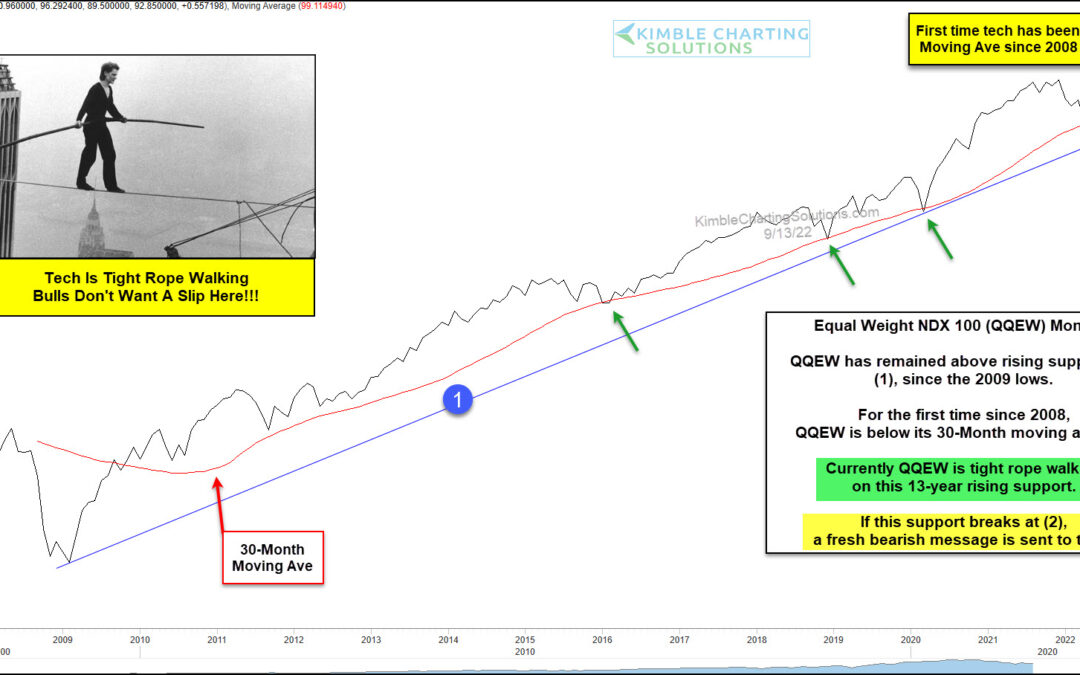
We have written several times about the importance of technology sector leadership. Better said, when tech stocks are healthy, the broader stock market is usually humming (bullish). But this year has seen the opposite. The Nasdaq 100 and Nasdaq Composite topped late...
