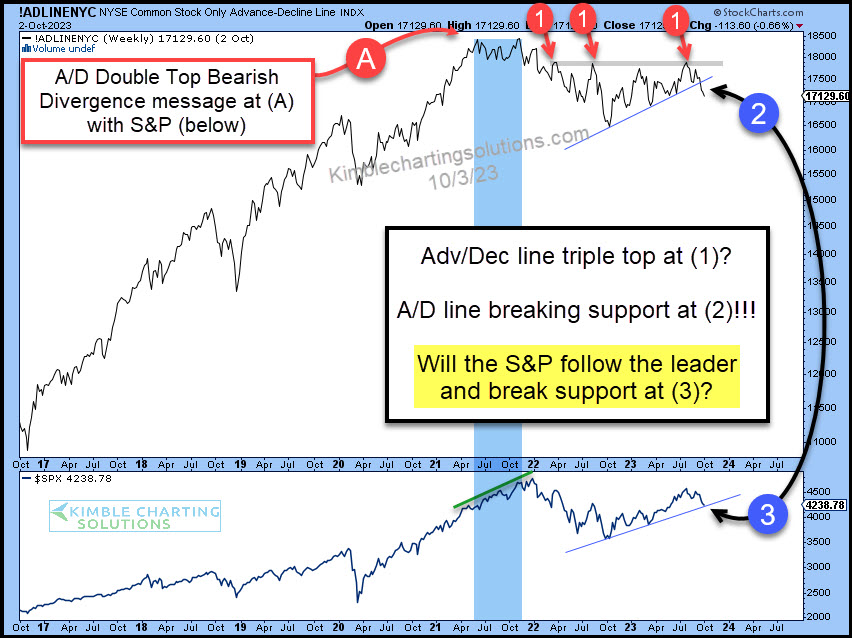
by Chris Kimble | Oct 5, 2023 | Kimble Charting
We have been highlighting several market indicators trading at critical time/price areas over the past month or so. And today is no different as we take a look at the Advance/Decline Line for NYSE common stocks. This is a very important measure of market breadth...
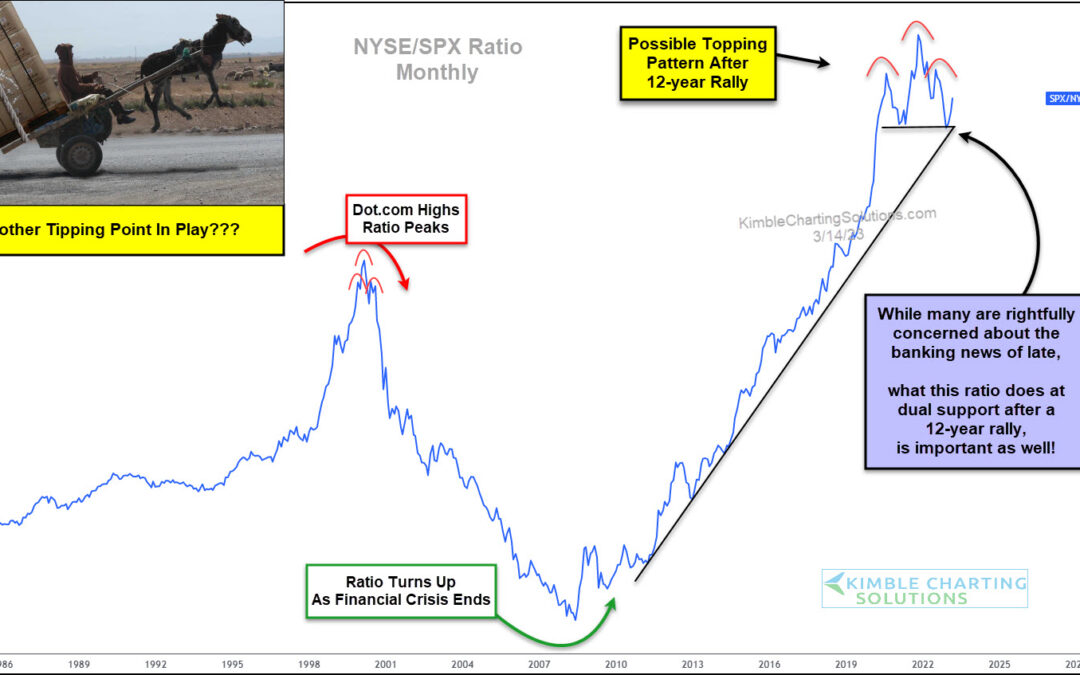
by Chris Kimble | Mar 16, 2023 | Kimble Charting
The New York Stock Exchange (NYSE) is a very broad measure of the stock market with over 2400 companies listed. So when the NYSE begins to underperform, market participants should pay attention! Well, this has been happening over the past year… and it may be reaching...
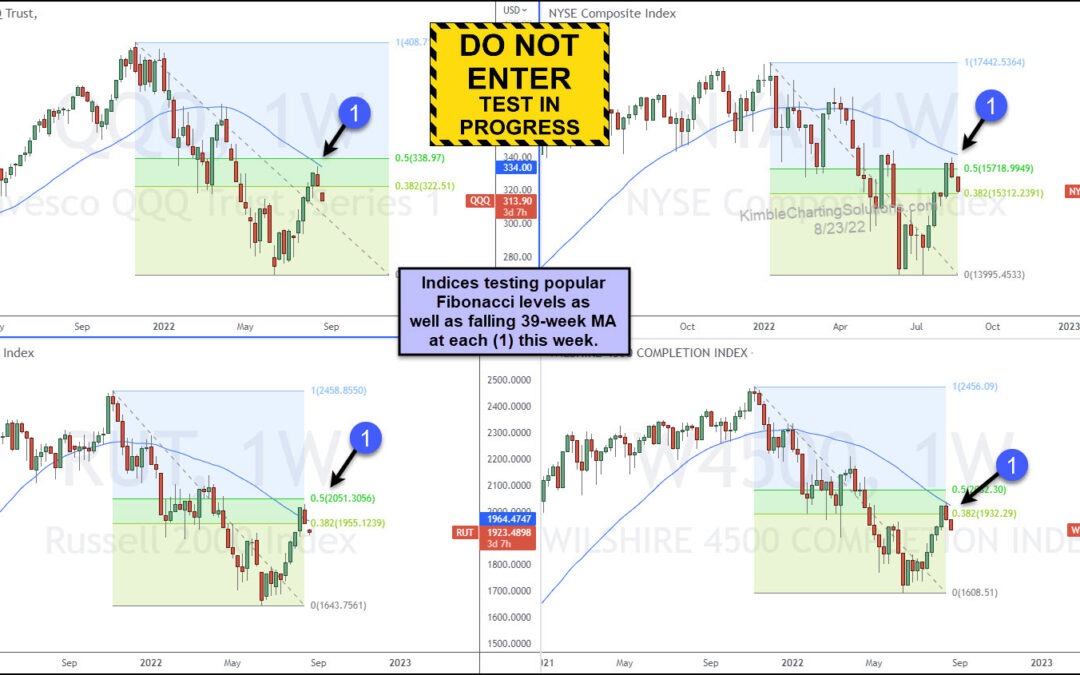
by Chris Kimble | Aug 24, 2022 | Kimble Charting
Several major U.S. stock market indices have bounced (rallied) over the past 2 months. But these moves higher are facing major test right now. And considering that we are in a bear market… these are just bounces until more constructive rallies take place with major...
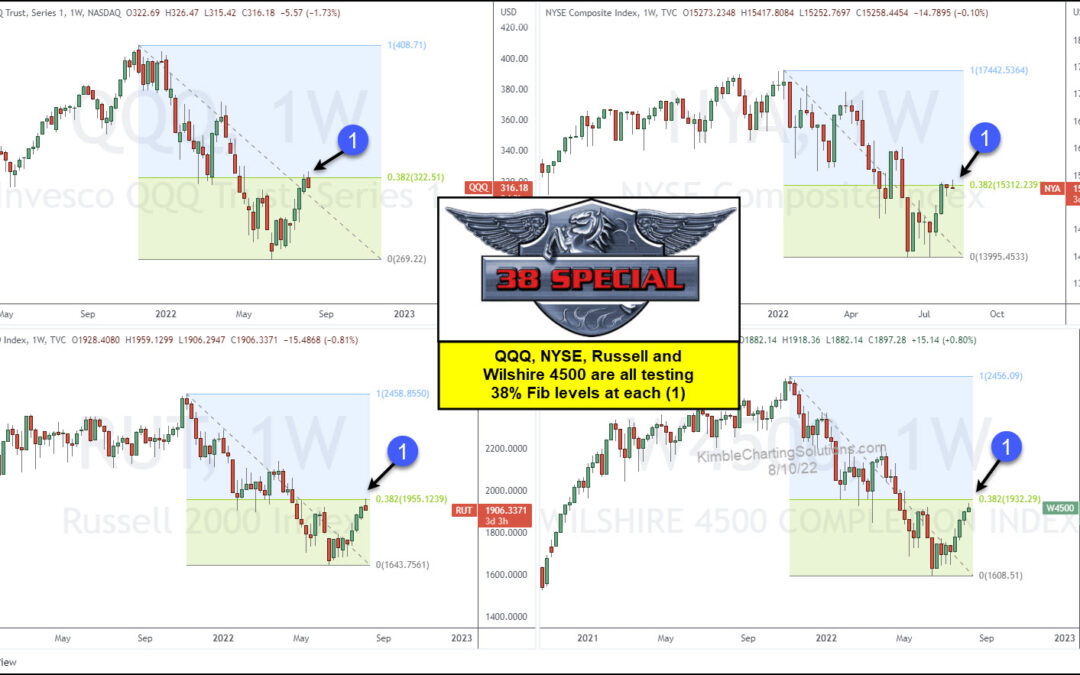
by Chris Kimble | Aug 11, 2022 | Kimble Charting
As the stock market bounce continues, wary investors are beginning to wonder about how much longer this rally will last. While no one can predict the future, we can utilize technical tools to gauge the rally’s health. Today we highlight a key Fibonacci...
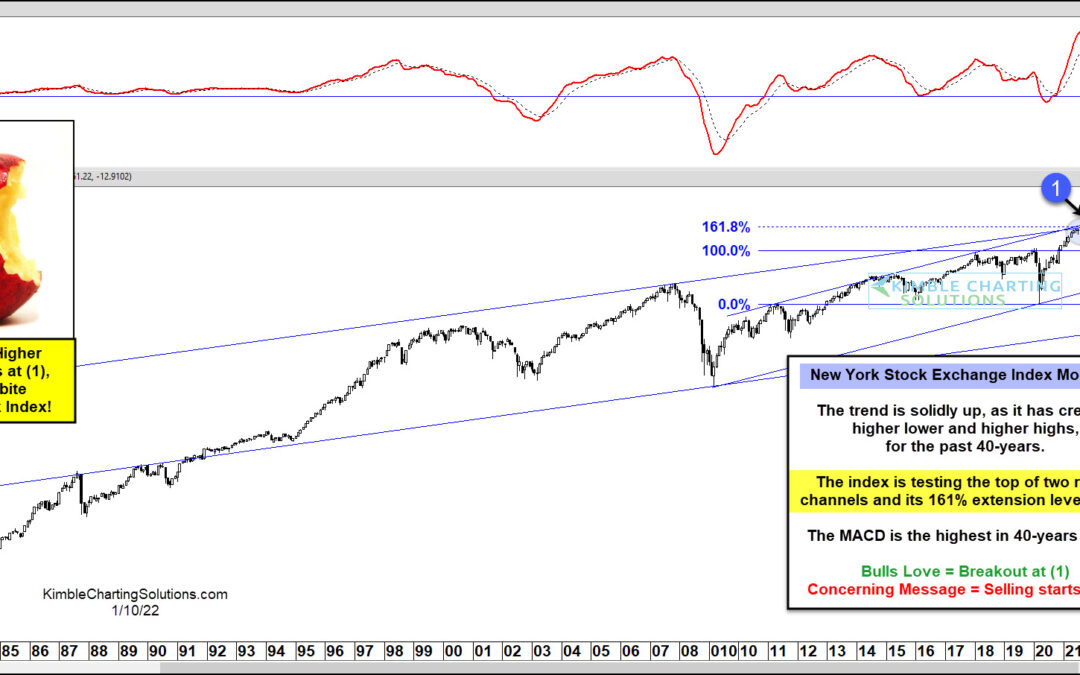
by Chris Kimble | Jan 10, 2022 | Kimble Charting
The stock market continues to trade at elevated levels as traders ring in the first week of the new year. But there are a few warning signs out there, including one we recently highlighted: the Nasdaq’s underperformance. Today, we look at an important stock market...
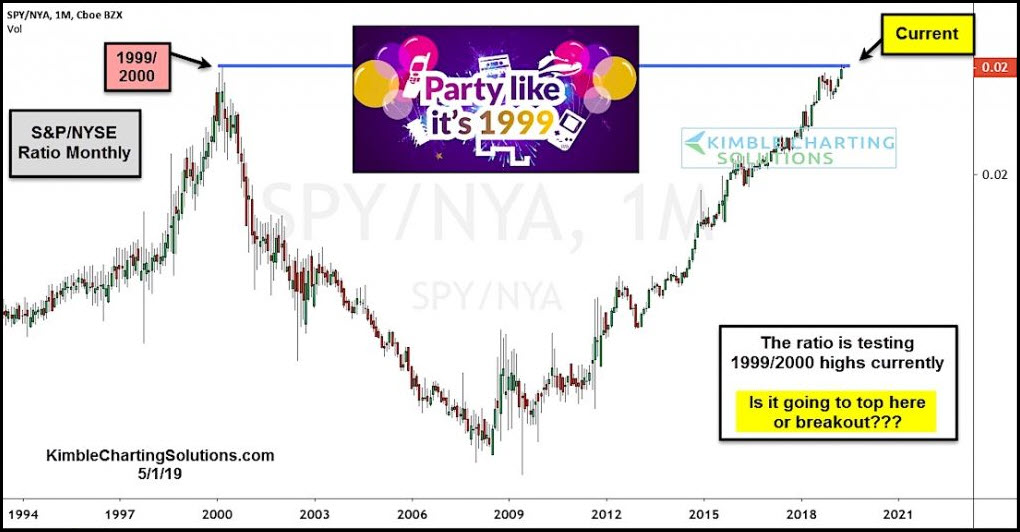
by Chris Kimble | May 5, 2019 | Kimble Charting
After enduring a deep stock market correction in late 2018, investors quickly bought up stocks. And the bull market resumed. It’s been a decade since the financial crisis lows, and two decades since the 1999 stock market blow-off bubble top. In today’s chart, we put...
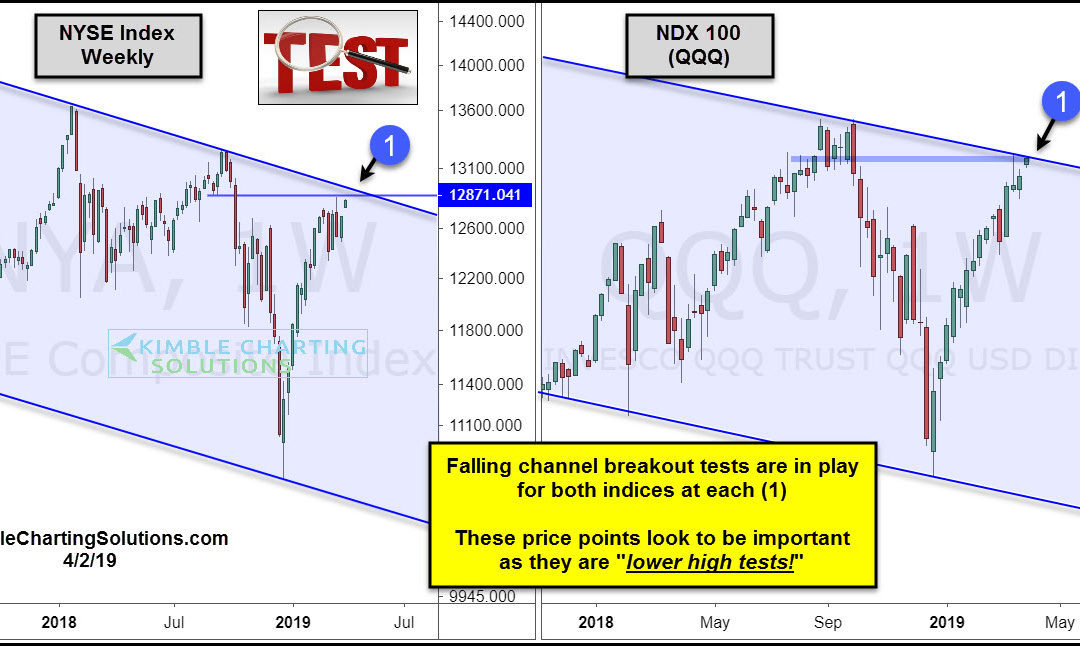
by Chris Kimble | Apr 2, 2019 | Kimble Charting
Is a very broad index and the Tech sector in the states testing important price points? We think so! These two charts reflect that these indices have created a series of lower highs and lower lows. The strong rally off the lows around Christmas have the New York Stock...
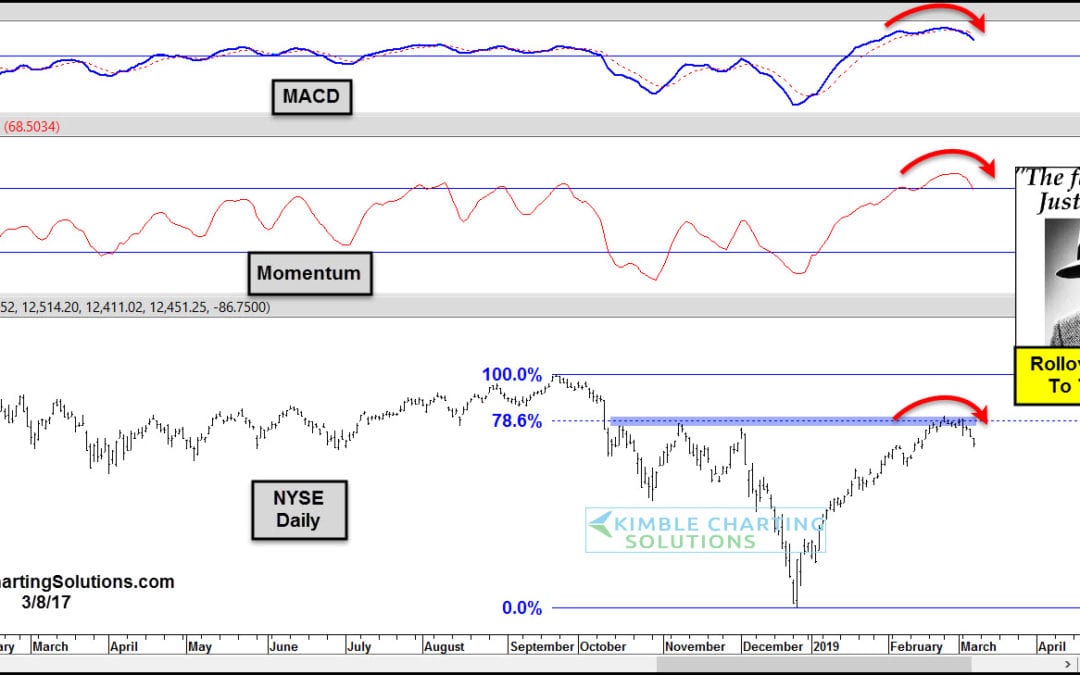
by Chris Kimble | Mar 8, 2019 | Kimble Charting
The NYSE Index is facing a very important price level as Momentum and the MACD are at the highest levels in a year! The 9-week rally from the late December lows has the NYSE index facing the October, November, December highs and its 78% retracement this past week. Joe...
