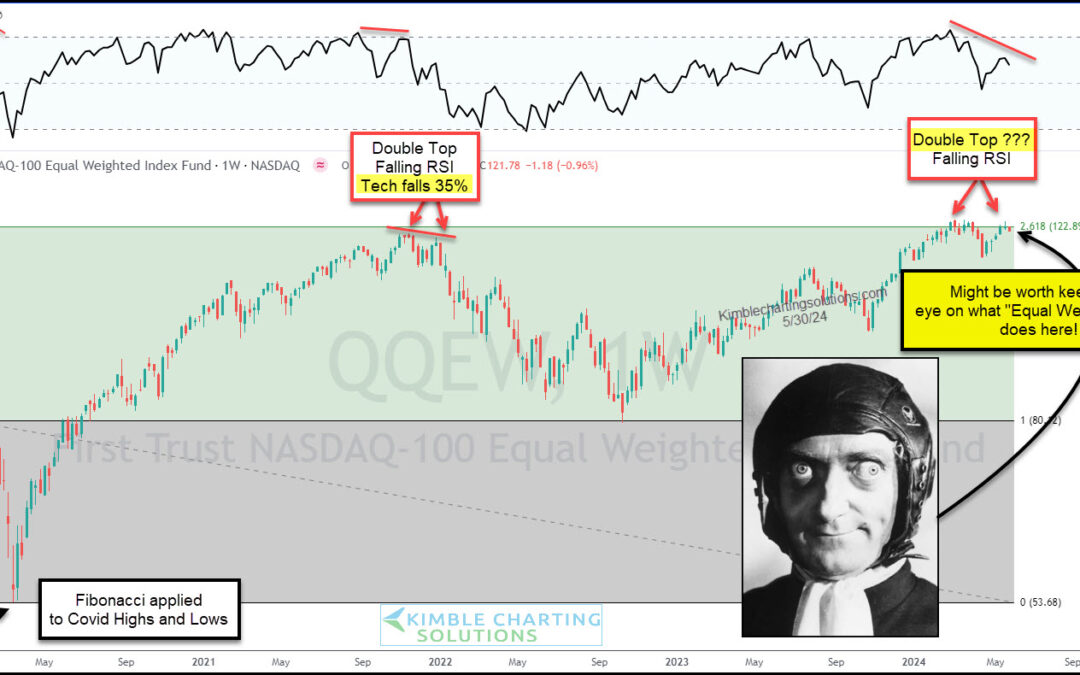
by Chris Kimble | May 31, 2024 | Kimble Charting
Technology stocks have continue to lead the broader market higher in 2024, posting new high after new high. At the same time, this is the very reason we watch the Nasdaq related indices very closely with each pause in the market. When leadership is strong, the market...
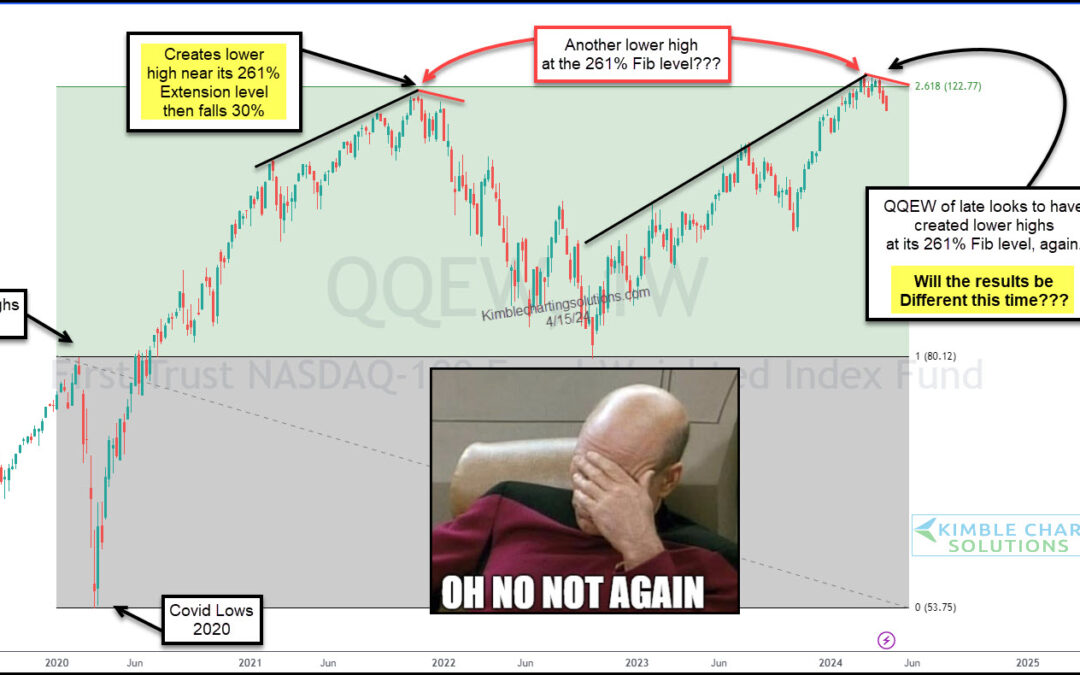
by Chris Kimble | Apr 17, 2024 | Kimble Charting
Technology stocks have been the engine behind the stock market rally into 2024. Even better stated, tech stocks have been a market leader since 2009. So it’s important to keep an eye on the performance of market leadership. And lately the tech-based Nasdaq indices...
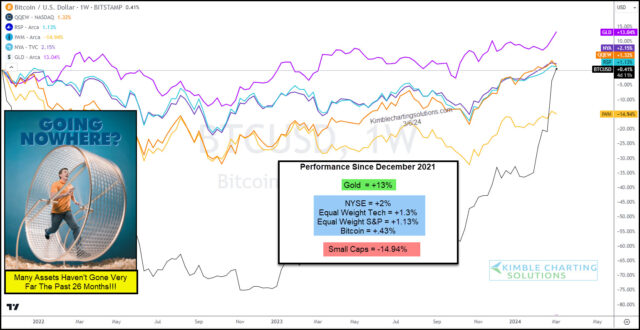
by Chris Kimble | Mar 8, 2024 | Kimble Charting
Several indicators of investor sentiment are showing rising “greed” levels. And when investors get greedy, it tends to imply that we are nearing a top. BUT, I am unsure why greed levels are so high when so many assets have little to brag about over the past few years!...
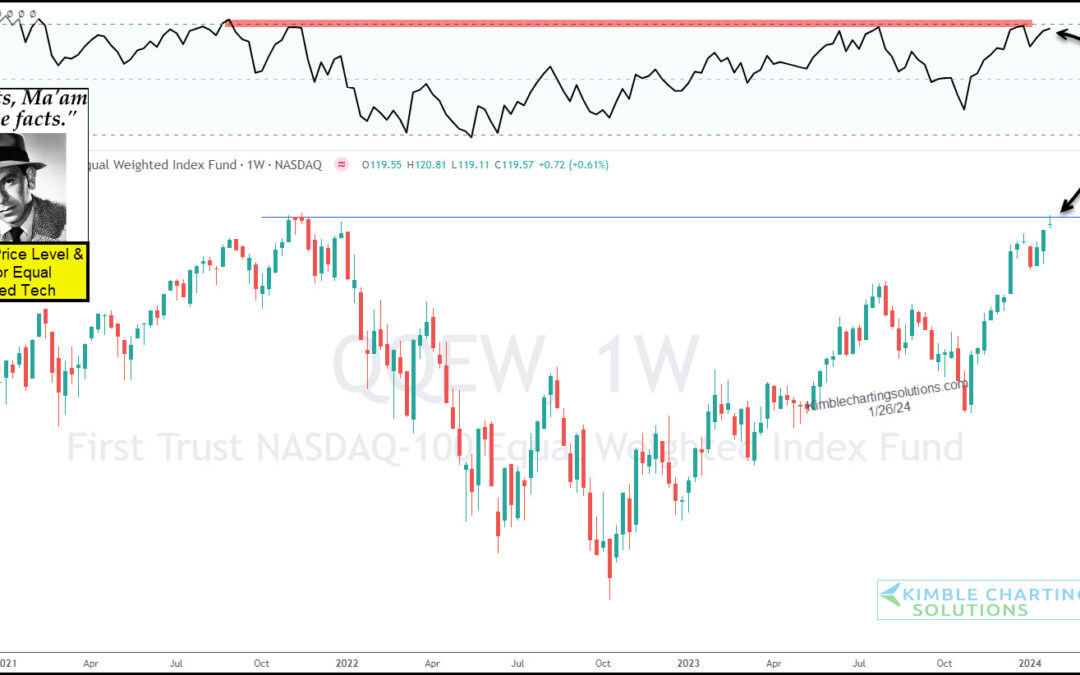
by Chris Kimble | Jan 29, 2024 | Kimble Charting
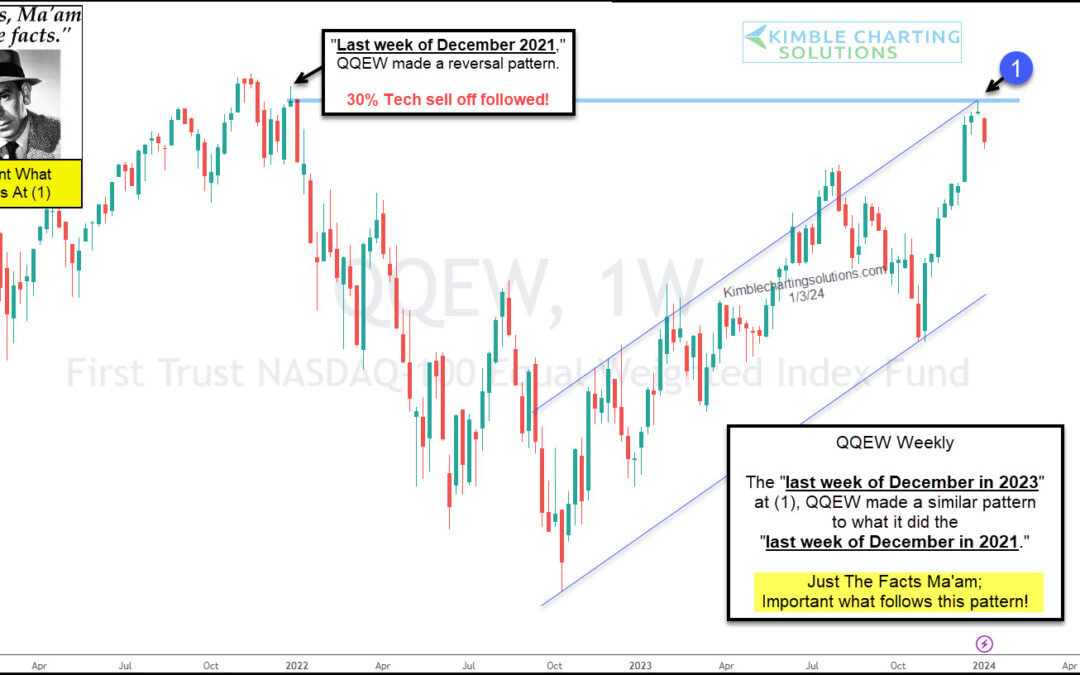
The end of year rally has trickled over into 2024 and it has been lead by tech stocks. But has the rally gotten long in the tooth? “The facts, Ma’am. Just the Facts.” – Joe Friday Today’s “weekly” chart of the Nasdaq 100 Equal Weight Fund (QQEW) highlights an...
by Chris Kimble | Jan 12, 2024 | Kimble Charting
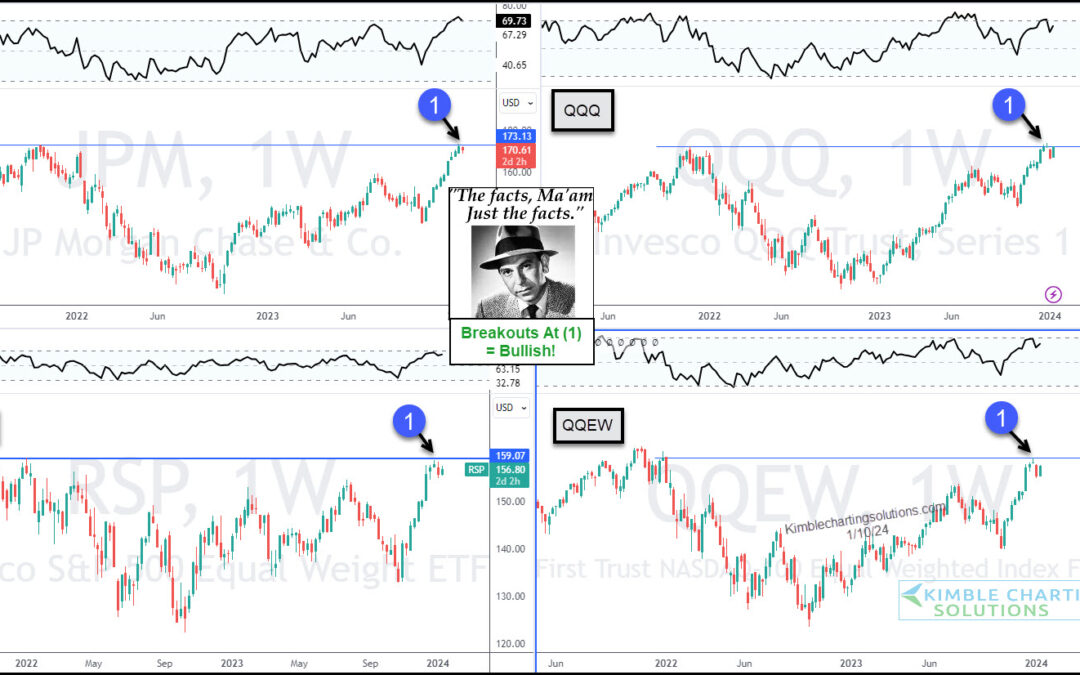
After a big year-end rally, the stock market attempts to consolidate gains in January. That consolidation has several stock indices and ETFs trading near recent price highs. “The facts, Ma’am. Just the facts.” – Joe Friday Today’s chart 4-Pack highlights a key bank...
by Chris Kimble | Jan 5, 2024 | Kimble Charting
We have spent a lot of time discussing the importance of technology stocks and how this area of leadership is a great “tell” for what’s to come. Today, we look at the Nasdaq 100 Equal Weight ETF (QQEW) and highlight why market participants should be watching right...
by Chris Kimble | Sep 13, 2023 | Kimble Charting
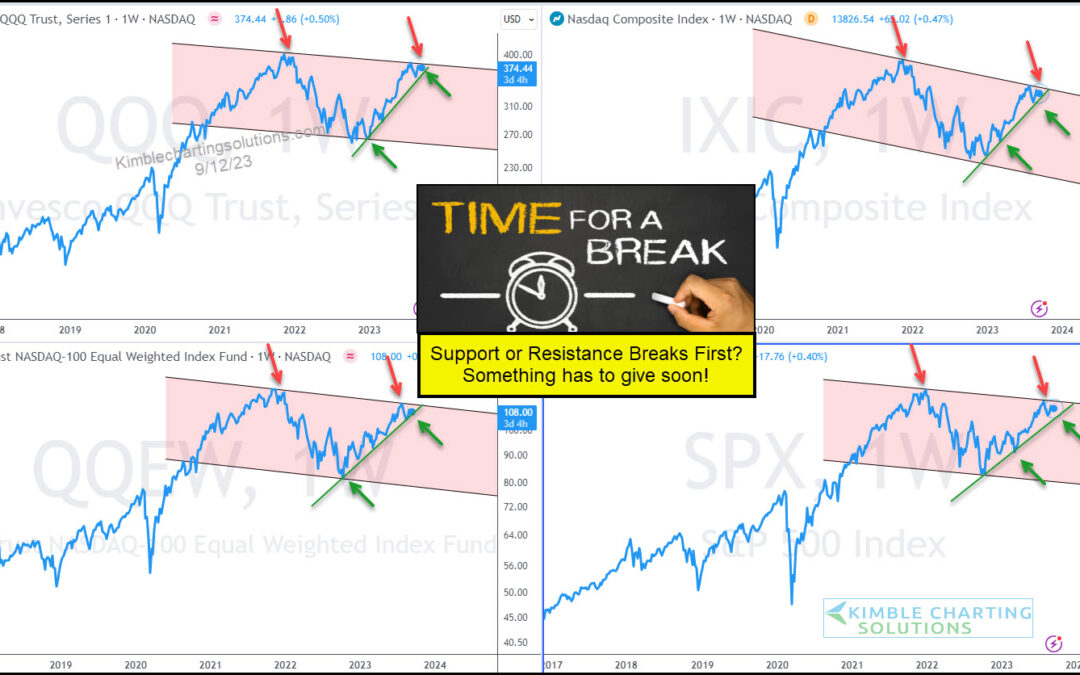
Without a doubt, technology stocks are the leader within global stock markets and the global economy. So when the technology sector nears a major trend decision point, investors and consumers should be watching! And that is exactly what we have on display today, as...
by Chris Kimble | Aug 18, 2023 | Kimble Charting
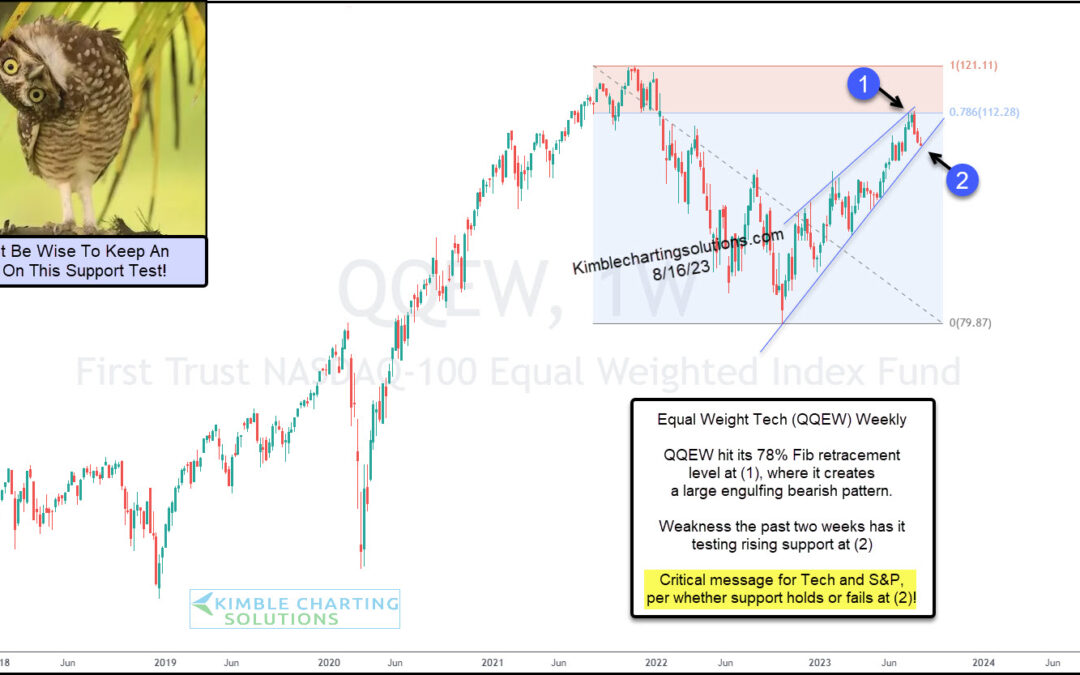
Tech stocks have been leaders once again in 2023 following its broad-based correction into 2022. BUT, we are not out of the woods just yet! Today’s chart looks at the Equal Weight Nasdaq 100 ETF (QQEW) and provides an insightful snapshot of the current state of large...
