by Chris Kimble | Sep 1, 2010 | Kimble Charting
Long “Downside wicks” frequently signal an asset is working on at least a short-term low. The 500 index has created a series of downside wicks at support of late and today falling resistance is being taken out to the upside. With the 500 breaking...

by Chris Kimble | Aug 26, 2010 | Kimble Charting
For those investors that would like to score on defense, a unique short-term opportunity is at hand. Support dating all the way back to the lows of 2009 was broken and is now being tested as resistance, along with two other key resistance lines, that all meet at the...

by Chris Kimble | Aug 19, 2010 | Kimble Charting
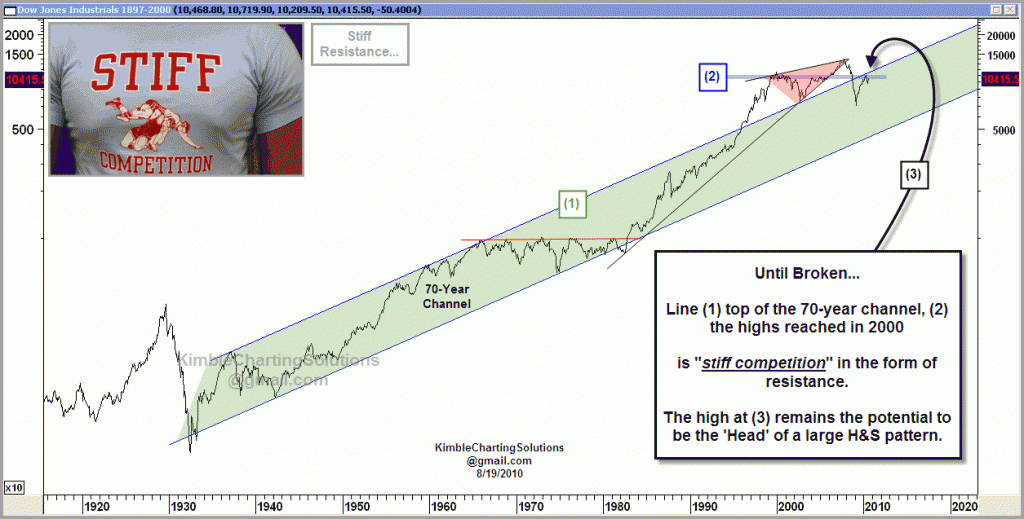
Dow has stiff competition in the form of resistance dating back 70-years… Interesting that the potential Head, in the head & shoulders pattern, tested the underside of this 70-year line. Keep this chart around for big picture...

by Chris Kimble | Aug 19, 2010 | Kimble Charting
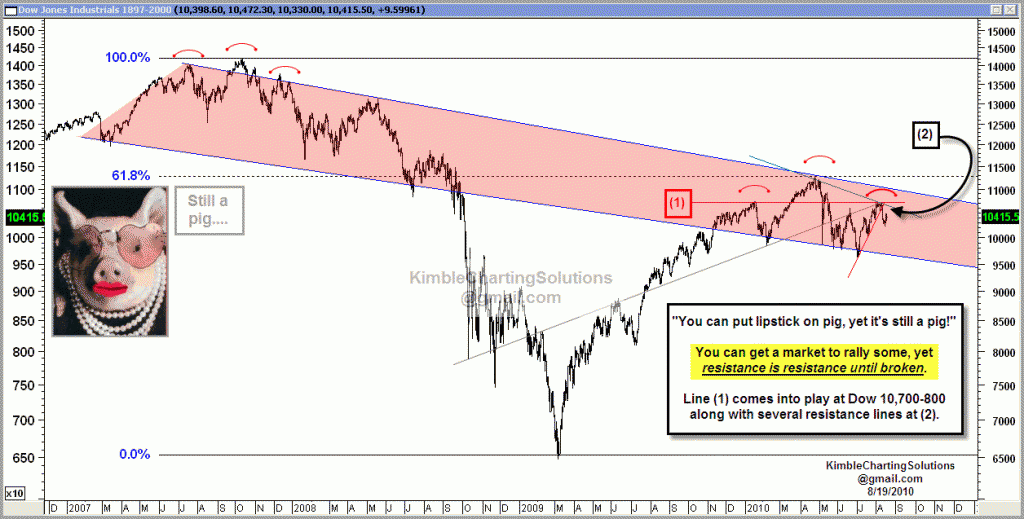
The saying goes something like….”you can put lipstick on a pig, yet it is still a pig!” Another good saying….”Resistance is Resistance until broken!” The Dow still faces resistance around the 10,700-10,800 area in the...


