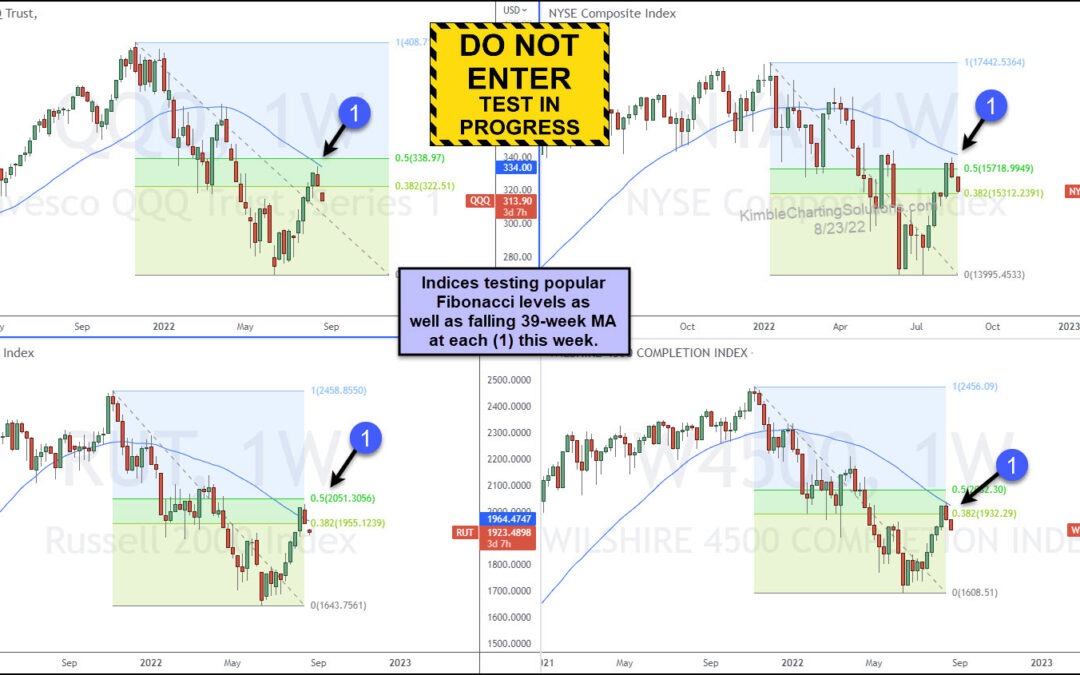
by Chris Kimble | Aug 24, 2022 | Kimble Charting
Several major U.S. stock market indices have bounced (rallied) over the past 2 months. But these moves higher are facing major test right now. And considering that we are in a bear market… these are just bounces until more constructive rallies take place with major...
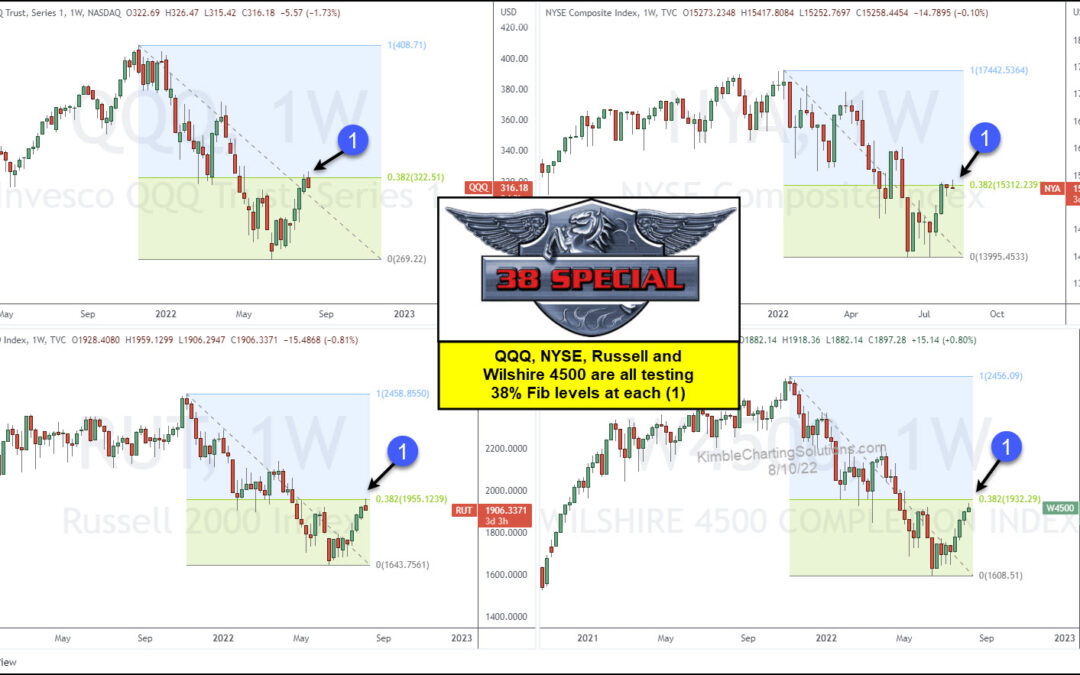
by Chris Kimble | Aug 11, 2022 | Kimble Charting
As the stock market bounce continues, wary investors are beginning to wonder about how much longer this rally will last. While no one can predict the future, we can utilize technical tools to gauge the rally’s health. Today we highlight a key Fibonacci...
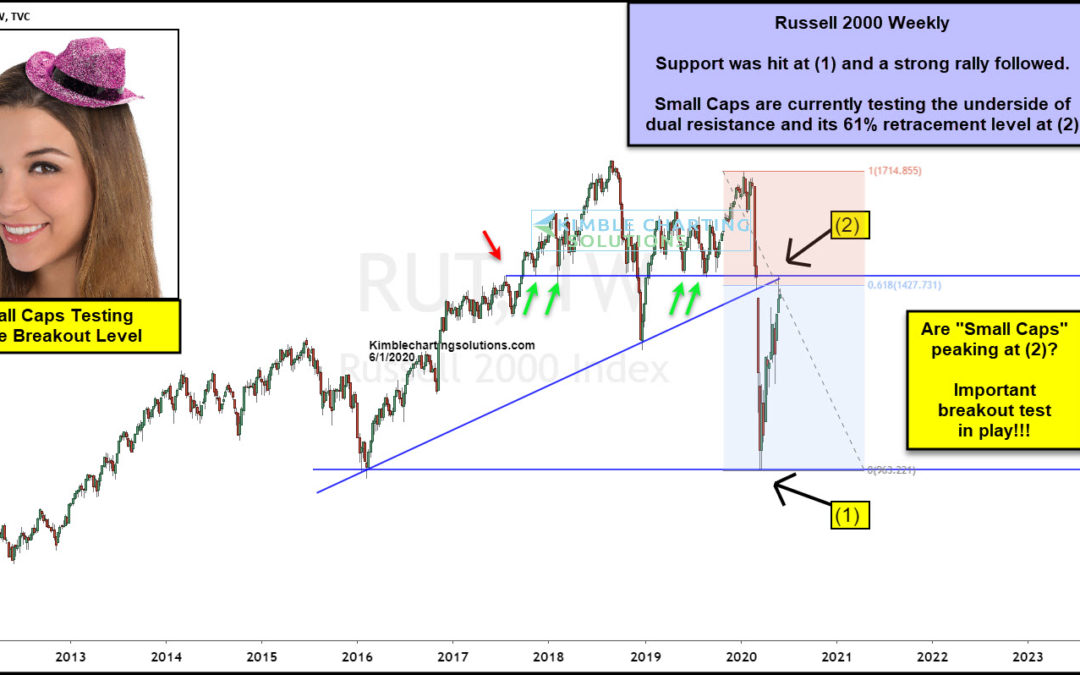
by Chris Kimble | Jun 3, 2020 | Kimble Charting
The Russell 2000 Index (RUT) has lagged the broader S&P 500 Index for much of the recovery rally off the March lows. But recently, the small caps stocks index has joined the fun. But the question is, can it last? In today’s chart, we highlight a very important...
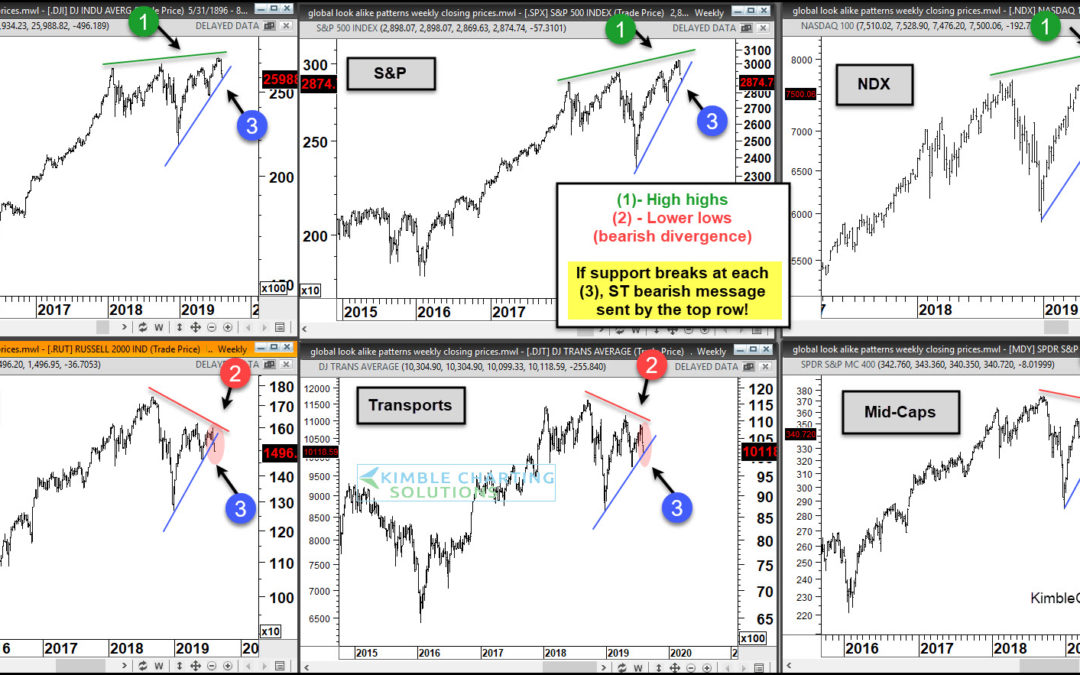
by Chris Kimble | Aug 7, 2019 | Kimble Charting
Stock Market Indexes Topping? Well, that was fast. The stock market pullback has been sharp and likely is not over yet. Last week, I shared the same chart, calling it a “moment of truth” for the stock market. Would the 3 underperforming stock market indexes (in the...
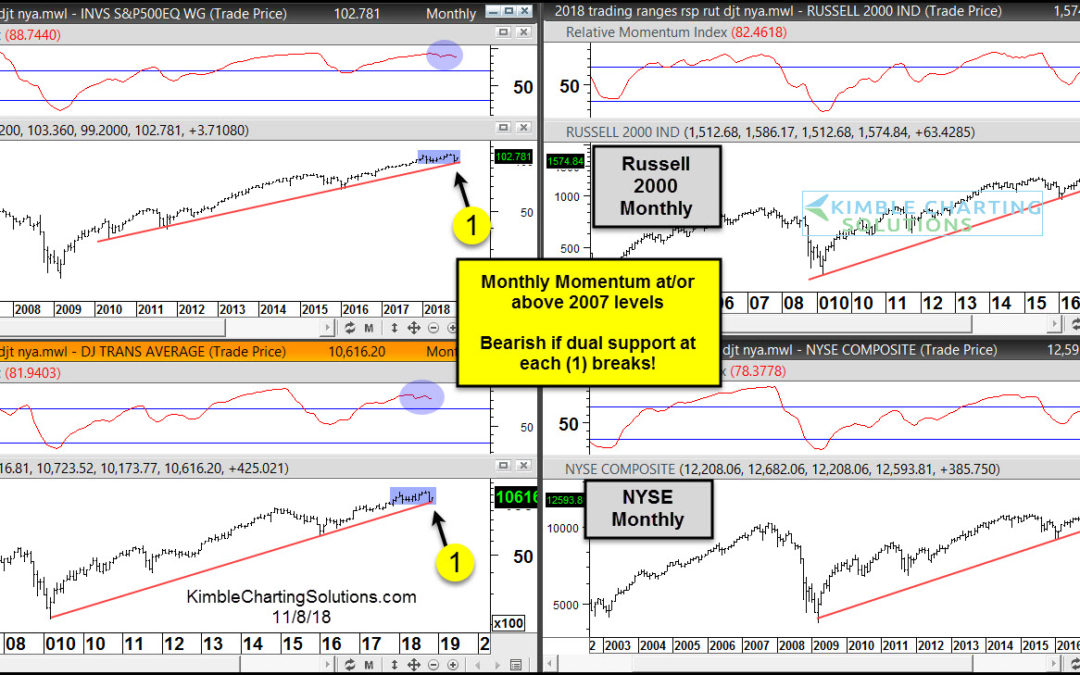
by Chris Kimble | Nov 10, 2018 | Kimble Charting
The latest stock market correction and swing lower has seen momentum drop to extreme lows (on a intermediate-term basis). This poses a bit of a conundrum because stocks have been struggling since hitting historic longer-term momentum highs. So what do investors make...
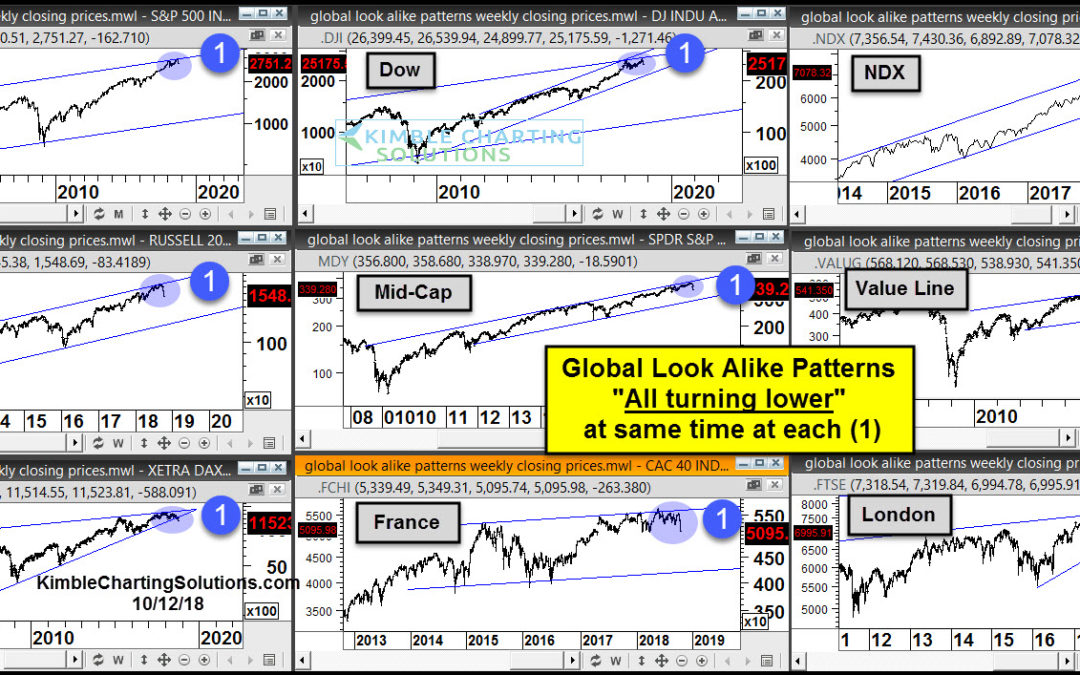
by Chris Kimble | Oct 18, 2018 | Kimble Charting
Over the past several weeks, I’ve shared several examples of key stock market indexes and indicators hitting long-term resistance. Today, we’ll do the same… but with a much wider lens. We’ll look at 9 different stock market indexes in the developed markets that look...
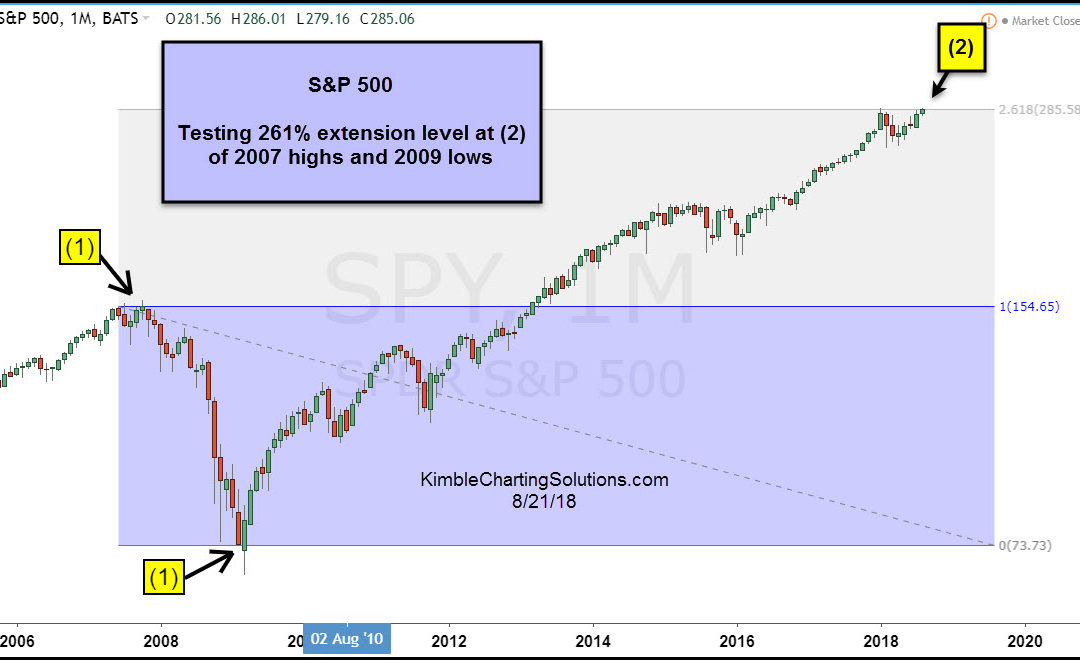
by Chris Kimble | Aug 22, 2018 | Kimble Charting
Will these chart patterns lead the bulls into a buying stampede or will Fibonacci extension levels become 800-pound resistance zones that will frustrate stock bulls? In my 38-years I haven’t seen so many stock market indices testing Fibonacci extension levels at the...
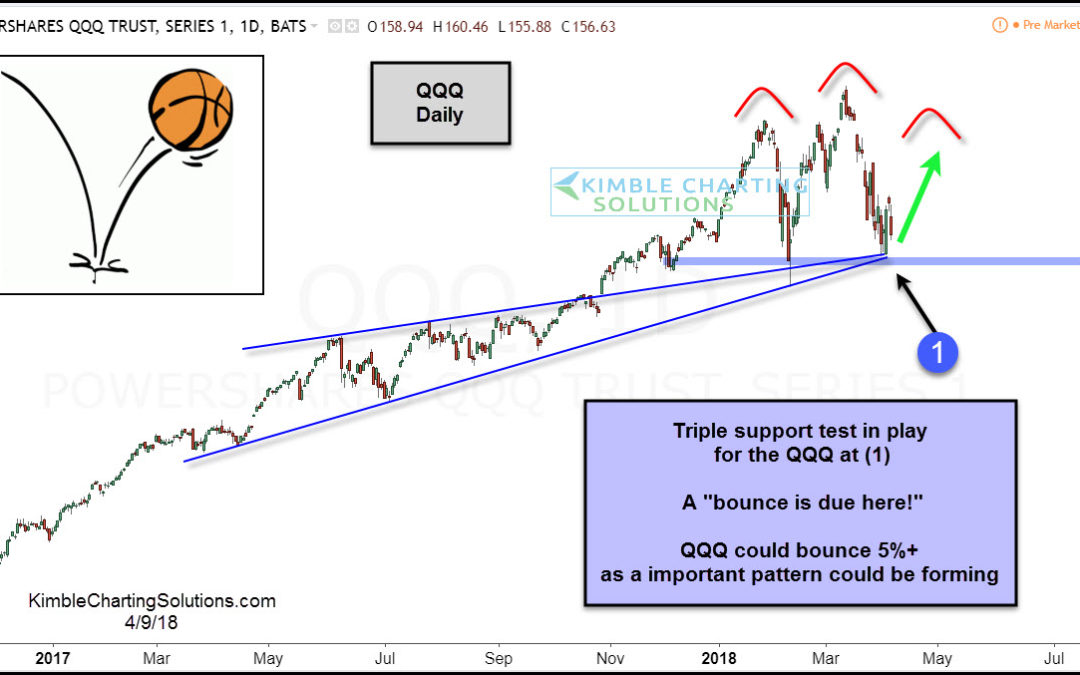
by Chris Kimble | Apr 9, 2018 | Kimble Charting
CLICK ON CHART TO ENLARGE The decline of late in Tech ETF QQQ has it testing triple support at (1). A bounce is due here and QQQ could bounce at least 5%+. Bulls want to be careful that if a bounce takes place that it could be forming an important topping pattern....
