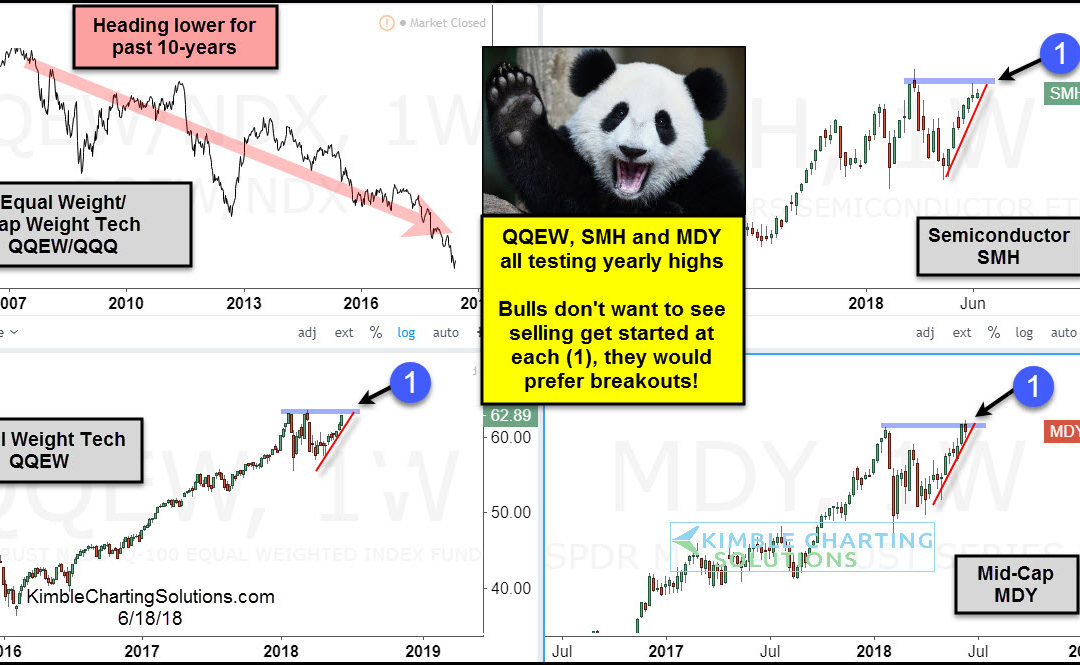
by Chris Kimble | Jun 18, 2018 | Kimble Charting
CLICK ON CHART TO ENLARGE The Trend for the Nasdaq and Semiconductors remains up, as each is near all-time highs and both are reflecting relative strength over the broad markets. Ths 4-pack above looks at some key price points for Tech and Mid-Caps that are in play at...

by Chris Kimble | Sep 4, 2014 | Kimble Charting
CLICK ON CHART TO ENLARGE Semiconductors bottomed and turned up before the broad markets in 2002 and 2008. They did the opposite in 2000 and 2007, as they started reflecting weakness before the broad market turned down. Are Semiconductors the holy grain of...
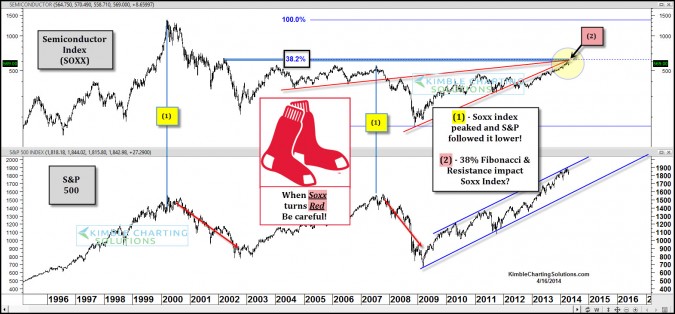
by Chris Kimble | Apr 16, 2014 | Kimble Charting
CLICK ON CHART TO ENLARGE The Semi Conductor index is known at the Soxx Index. The above chart highlights that when the Soxx indexed peaked and turned lower at (1) in 2000 & 2007, the S&P 500 soon followed this leader! Currently the SOXX index is...
by Chris Kimble | Jun 20, 2011 | Kimble Charting
One stock does not make a market….yet if their was one stock that could send a major market signal…could Apple be the one??? CLICK ON CHART TO ENLARGE Apple almost doubled in price since the lows of 2/2010. Now a support line drawn from those...
