
by Chris Kimble | Apr 8, 2019 | Kimble Charting
The GDXJ/GDX (Junior/Senior Miners) Ratio can create meaningful reversal patterns and send important signals to the mining sector, at key inflection points. Did the ratio send an important signal to miners last week? Possible! The GDXJ/GDX ratio has traded sideways...
by Chris Kimble | Mar 4, 2019 | Kimble Charting
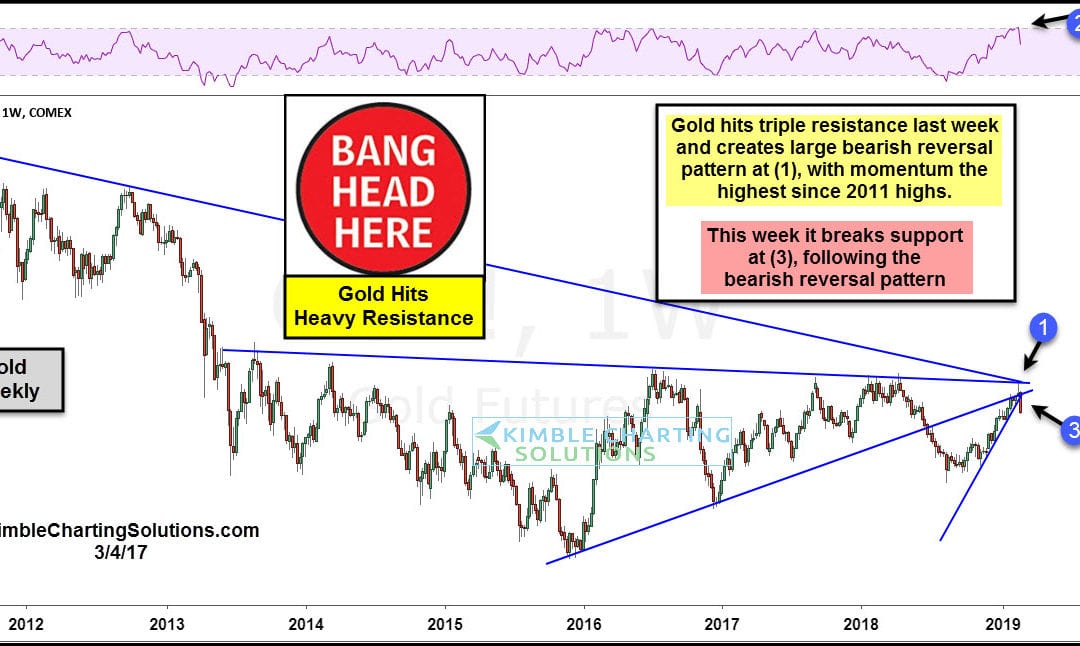
Precious metals have been a hot topic for investors and the financial markets. Gold, in particular, has caught the eye of market participants. After a 6 month rally into February, Gold futures reversed hard to the downside. This reversal came as gold prices tested...
by Chris Kimble | Mar 2, 2019 | Kimble Charting
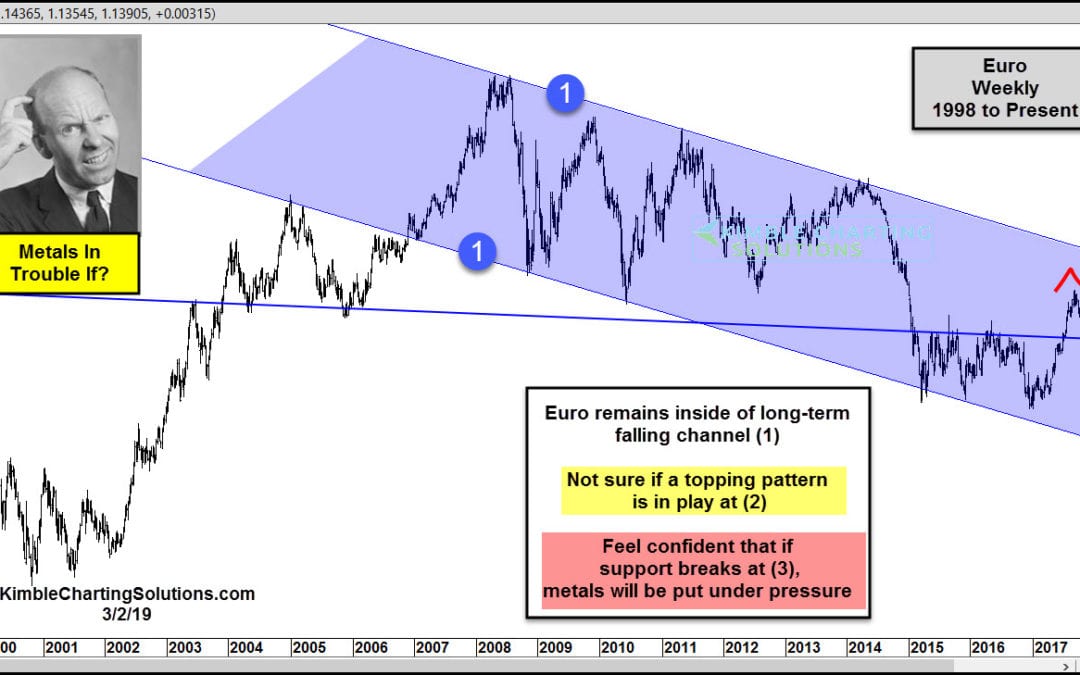
The Euro is facing an important price test that could highly influence the next big move in the metals markets. From a very long-term perspective, the Euro remains inside falling channel (1), where it has created a series of lower highs and lower lows for nearly...
by Chris Kimble | Feb 25, 2019 | Kimble Charting
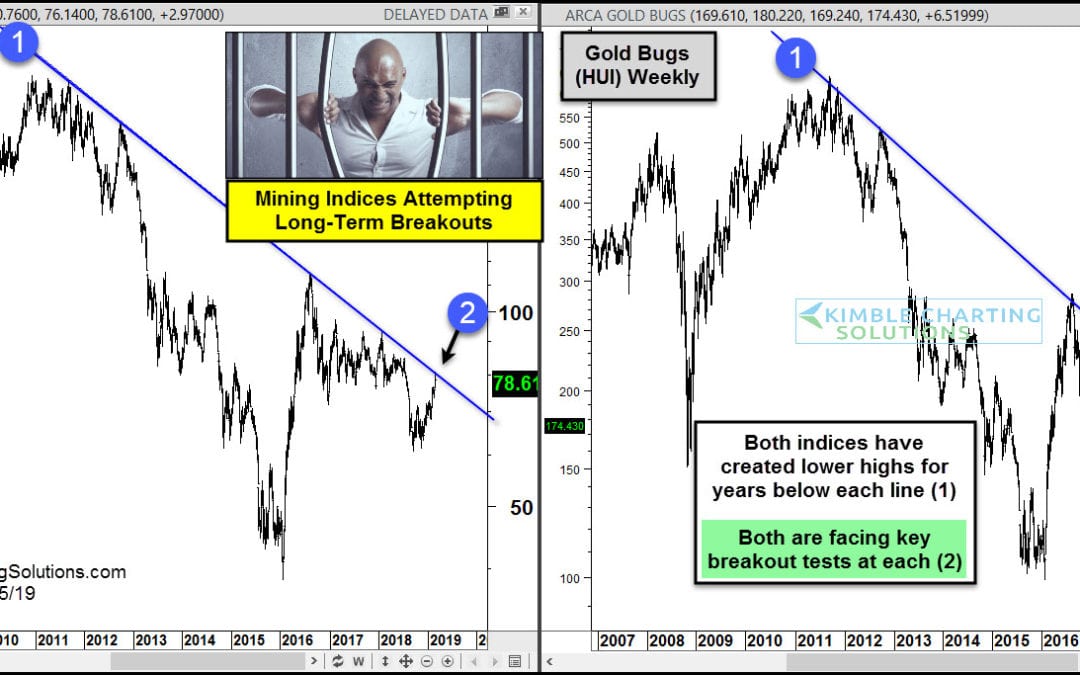
Mining stocks are facing an opportunity they haven’t seen many times in the past 8-years! This 2-pack looks at the Gold Bugs Index (HUI) and the Gold & Silver Miners (XAU) Index over the past 12-years. Since the highs in 2011, both have created a series of...

by Chris Kimble | Feb 21, 2019 | Kimble Charting
Could Silver be creating a topping pattern at current prices? Possible, still too soon to tell though! The first chart looks at Silver Futures on a daily over the past 18-months. The rally since Mid-November reflects that Silver is testing highs of a few weeks ago at...
by Chris Kimble | Jan 15, 2019 | Kimble Charting
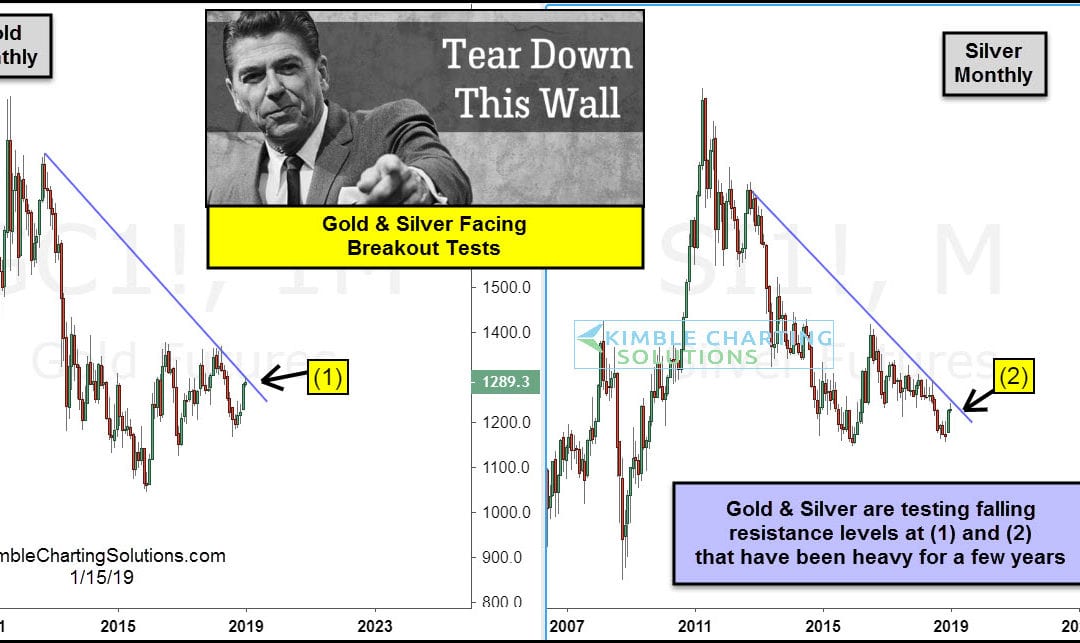
Gold and Silver from a long-term perspective have created a series of lower highs over the past 8-years. Will 2019 bring a change to this trend? A big test is in play! Gold since the lows in 2016 has created a series of higher lows, while Silver may have created a...
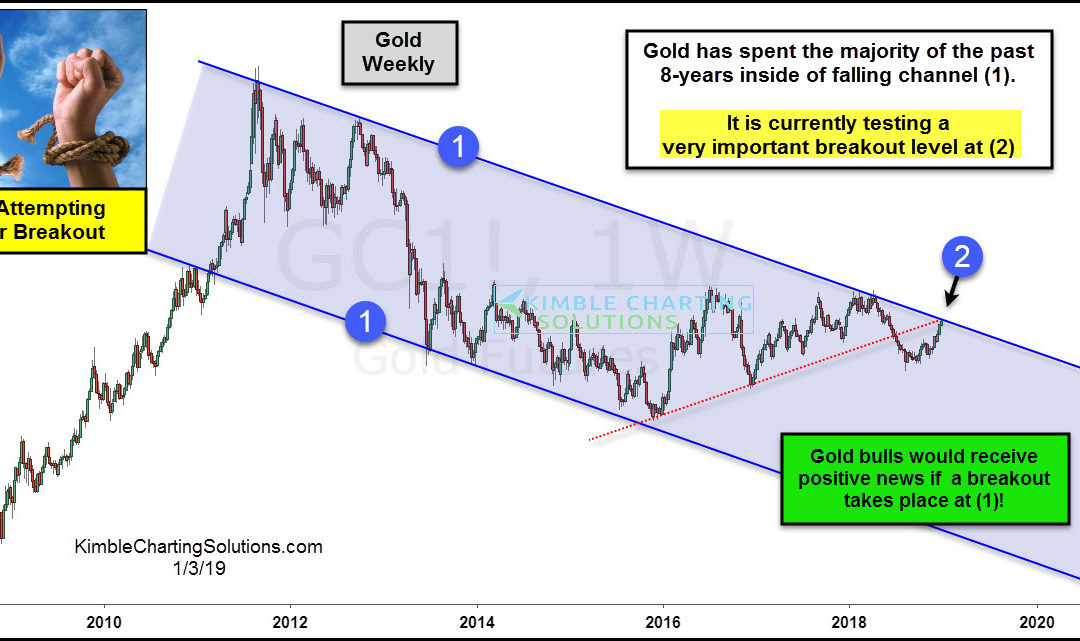
by Chris Kimble | Jan 3, 2019 | Kimble Charting
Since the 2011 highs, Gold futures have created a series of lower highs and lower lows inside of falling channel (1). The rally since the lows in 2016 has Gold facing the top of its 8-year falling channel at (2). This test comes into play as resistance for Gold,...
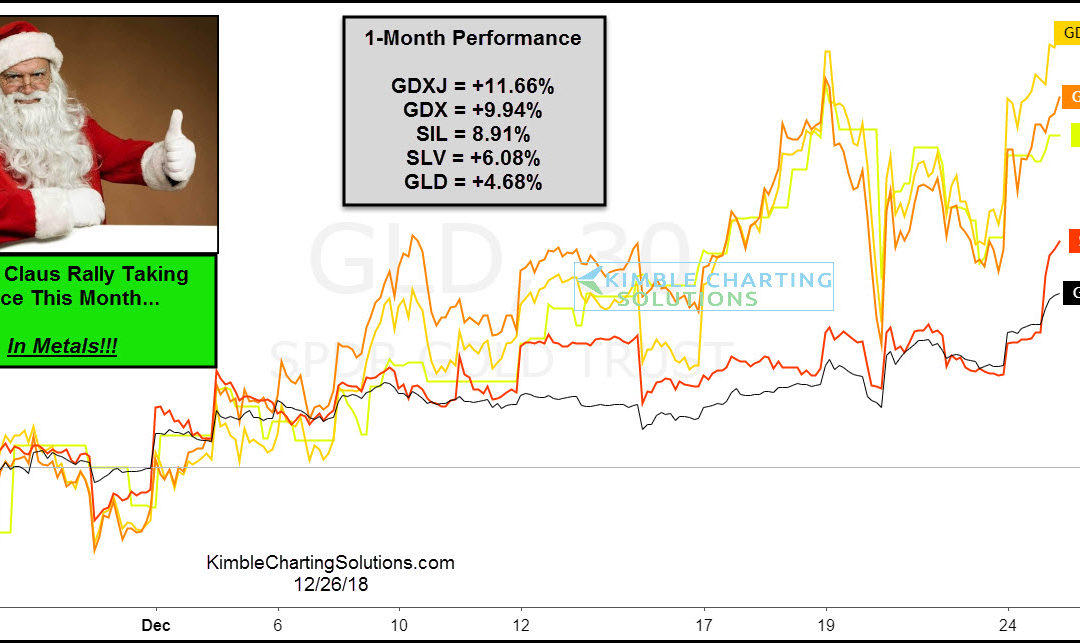
by Chris Kimble | Dec 26, 2018 | Kimble Charting
While it’s easy to find articles that suggest a Santa Claus rally isn’t taking place this year, the Power of the Patterns would disagree! This chart looks at the performance from several assets in the metals sector the past 30-days. Even though all of...
