by Chris Kimble | Oct 8, 2018 | Kimble Charting
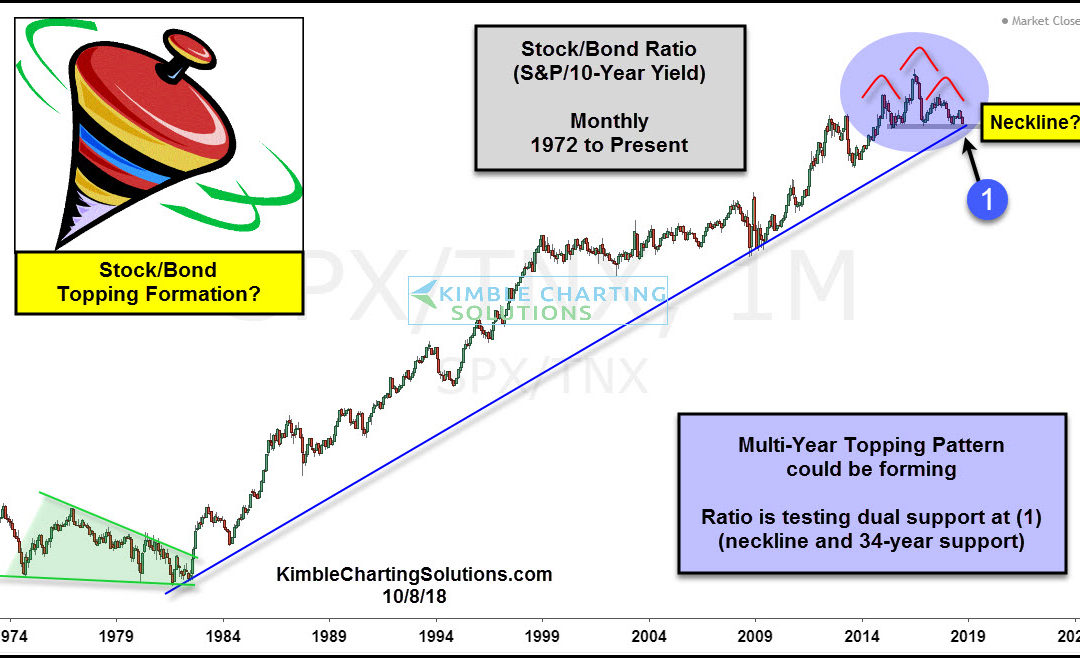
CLICK ON CHART TO ENLARGE This chart compares the relative strength of Stocks to bonds by creating the S&P 500/10-Year yield ratio (SPX/TNX) on a monthly basis, since the mid-1970’s. The stock/bond ratio’s trend has been up for the past 34-years,...
