877-721-7217 services@kimblechartingsolutions.com
  • Twitter
  • Twitter
  • Terms of Use
  • Contact
0 Items
Kimble Charting Solutions
  • Blog Sign Up
  • Free Research (Blog)
  • Research Subscriptions
    • Most Popular Research
    • Premium Member Research
    • Weekly Research Reports
  • What We Do
    • What We Do For You
    • Charts Solve These Investing Challenges
    • What You Receive
  • About Us
    • About Us
    • Testimonials
    • Videos
    • As Seen On
  • Login
Select Page
Tesla Completing A Bearish “Eiffel Tower” Topping Pattern, While At Resistance?

Tesla Completing A Bearish “Eiffel Tower” Topping Pattern, While At Resistance?

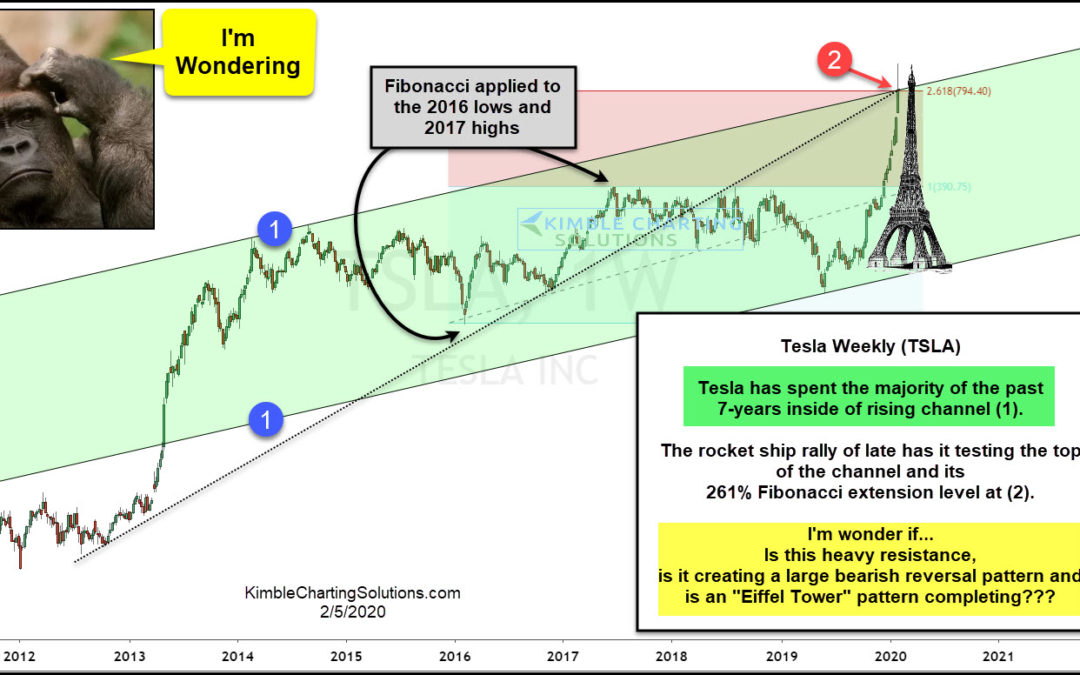
by Chris Kimble | Feb 5, 2020 | Kimble Charting

Tesla have been charging higher since the lows of last May, as it has rallied from $200 a share to nearly $800! Is it about to run out of juice? This chart looks at Tesla (TSLA) over the past 9-years. It has spent the majority of the past 7-years, inside of bullish...
Tesla About To Run Out Of Energy Here? Short-Term Peak Possible?

Tesla About To Run Out Of Energy Here? Short-Term Peak Possible?

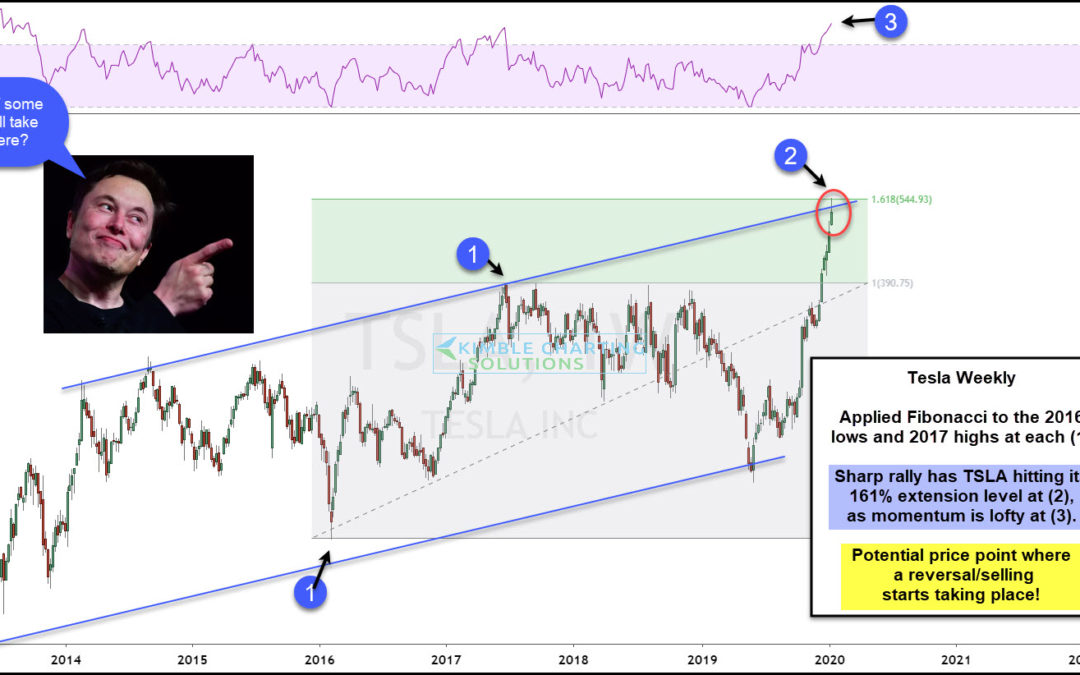
by Chris Kimble | Jan 16, 2020 | Kimble Charting

Tesla (TSLA) has been screaming higher of late, as very impressive gains have taken place. Is Tesla about to run out of energy/take a break/experience some selling pressure? A unique price setup is in play, that bulls might want want to be aware of. This chart applies...

Topic Areas

10-year yield Apple Banks bonds China Commodities Copper CRB Index Crude Oil DAX Doc Copper Dollar Update Dow Jones Emerging Markets Euro GDX gdxj gld gold Gold Bugs Gold Stocks Govt. bonds High Yields Interest Rates Joe Friday Junk Bonds Kimble Charting King Dollar NASDAQ 100 ndx 100 NYSE Composite QQQ Russell 2000 S&P S&P 500 Shanghai index silver slv SPX spy TLT US dollar What would you do? Wilshire 5000 Yields
  • Terms of Use
  • Contact
  • Twitter

Copyright ©2023 Kimble Charting Solutions. All Rights Reserved | Design by 16Wells