877-721-7217 services@kimblechartingsolutions.com
  • Twitter
  • Twitter
  • Contact
  • Cart
0 Items
Kimble Charting Solutions
  • Blog Sign Up
  • Free Research (Blog)
  • Research Subscriptions
    • Most Popular Research
    • Premium Member Research
    • Weekly Research Reports
  • What We Do
    • What We Do For You
    • Charts Solve These Investing Challenges
    • What You Receive
  • About Us
    • About Us
    • Testimonials
    • Videos
    • As Seen On
  • Login
Select Page
Bear Market Omen? The ‘Average Stock’ Is Breaking Down

Bear Market Omen? The ‘Average Stock’ Is Breaking Down

by Chris Kimble | Dec 11, 2018 | Kimble Charting

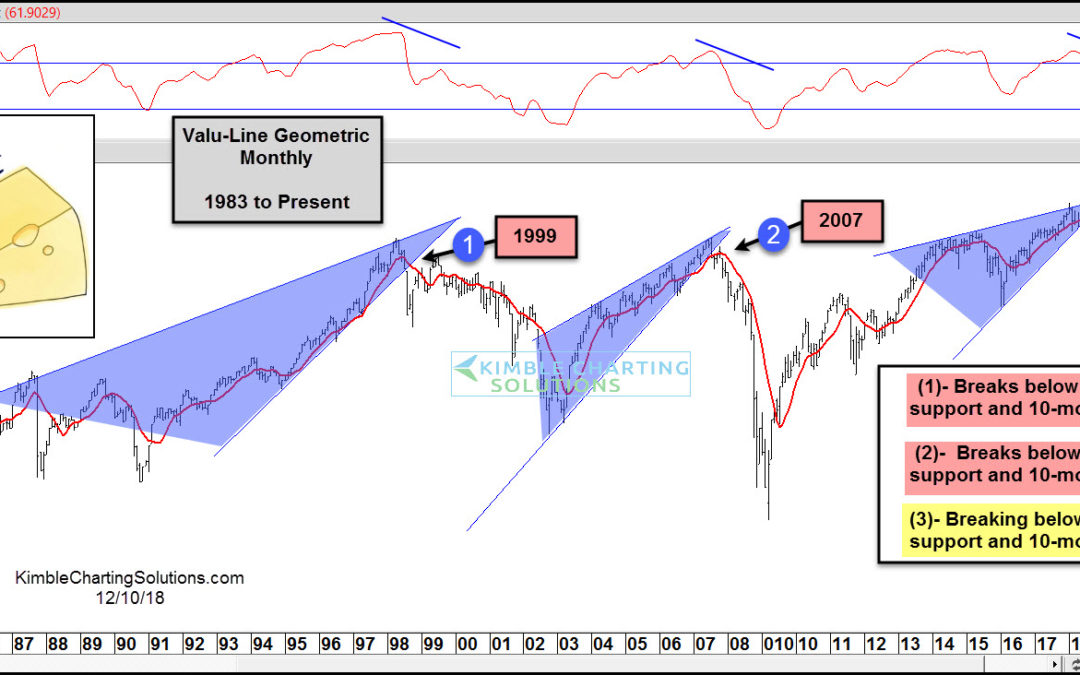
The stock market has been in a corrective sideways move for the better part of 2018. Is it ready to decline even lower? Well if the “average stock” is any indication, then investors should be concerned. The “monthly” chart below is of the Value Line Geometric...

Topic Areas

10-year yield Apple Banks bonds China Commodities Copper CRB Index Crude Oil DAX Dollar Update Dow Jones Emerging Markets Euro GDX gdxj gld gold Gold Bugs Gold Stocks Govt. bonds High Yields Interest Rates Joe Friday Junk Bonds Kimble Charting Mid-Caps NASDAQ 100 ndx 100 Nikkei 225 NYSE Composite real estate Russell 2000 S&P S&P 500 Shanghai index silver slv SPX spy TLT US dollar What would you do? Wilshire 5000 Yields
  • Terms of Use
  • Contact
  • Twitter

Copyright ©2021 Kimble Charting Solutions. All Rights Reserved | Design by 16Wells