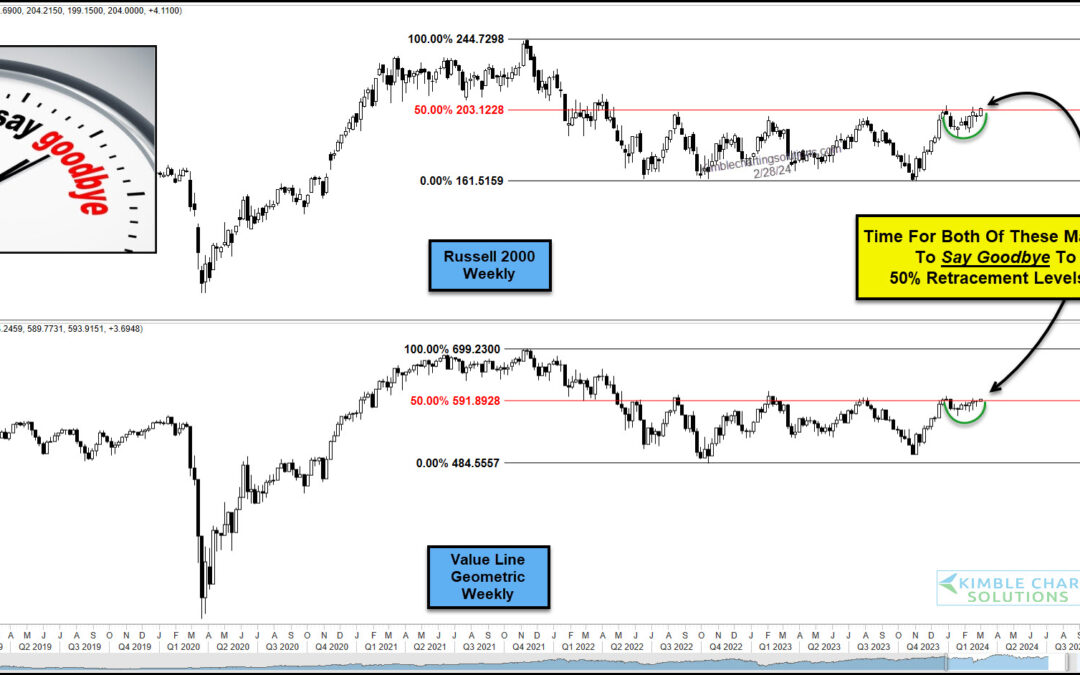
by Chris Kimble | Feb 29, 2024 | Kimble Charting
It is fair to say that the stock market has been lead higher by technology stocks and large cap stocks, in general. But two stock market indices that historically have been key to broad market rallies have under-performed: the small cap Russell 2000 Index and the...
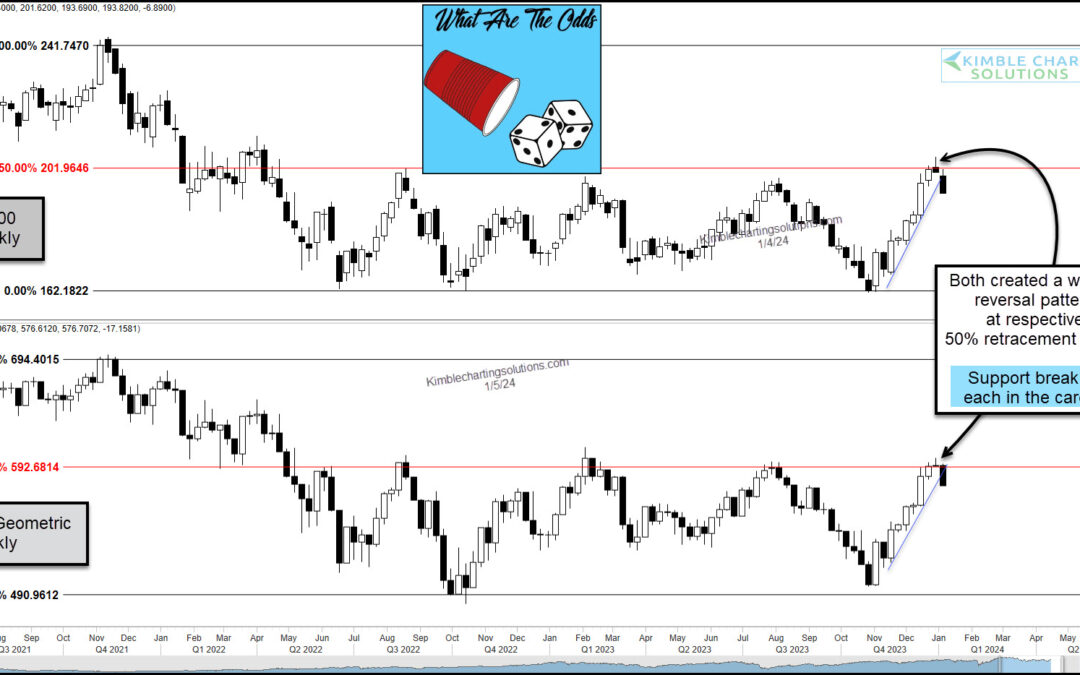
by Chris Kimble | Jan 8, 2024 | Kimble Charting
For the past two years, the Russell 2000 and Value Line Geometric Indexes have been lagging. Recently, however, both have come alive… adding a tailwind to the end of year rally. BUT these short-term rallies may be in trouble. Which also could mean that the broad...
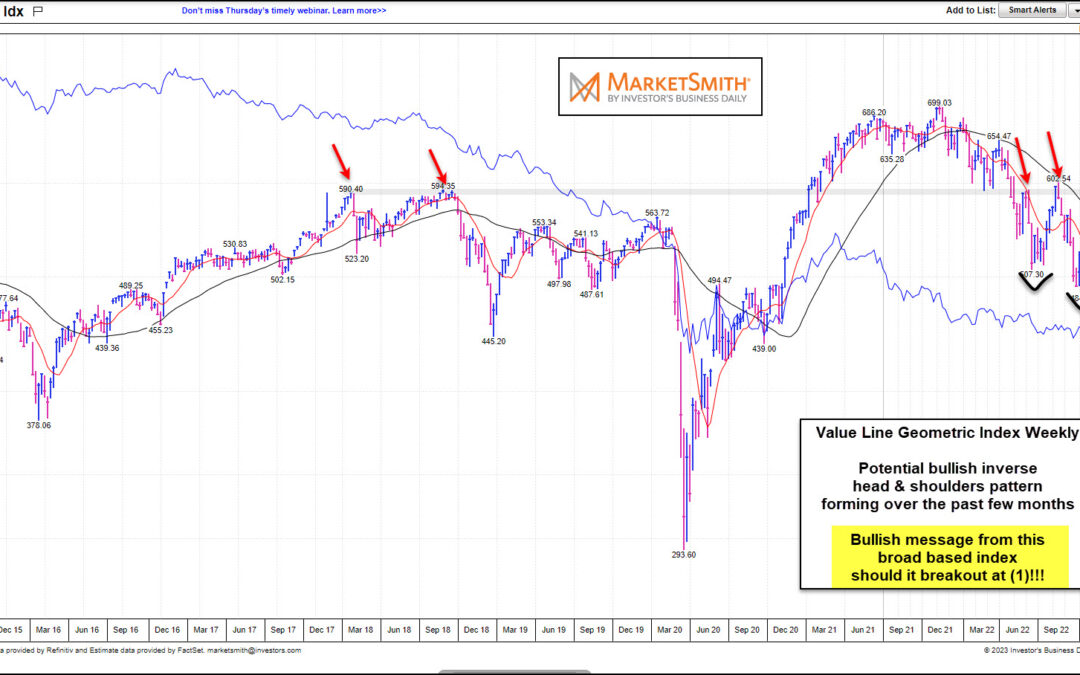
by Chris Kimble | Feb 1, 2023 | Kimble Charting
The Value Line Geometric Index is one of the broadest stock market indices. So when its price records a notable reversal, breakout, or breakdown, investors should listen. Today we take a closer look at the “weekly” chart of the Value Line Geometric Index that comes...
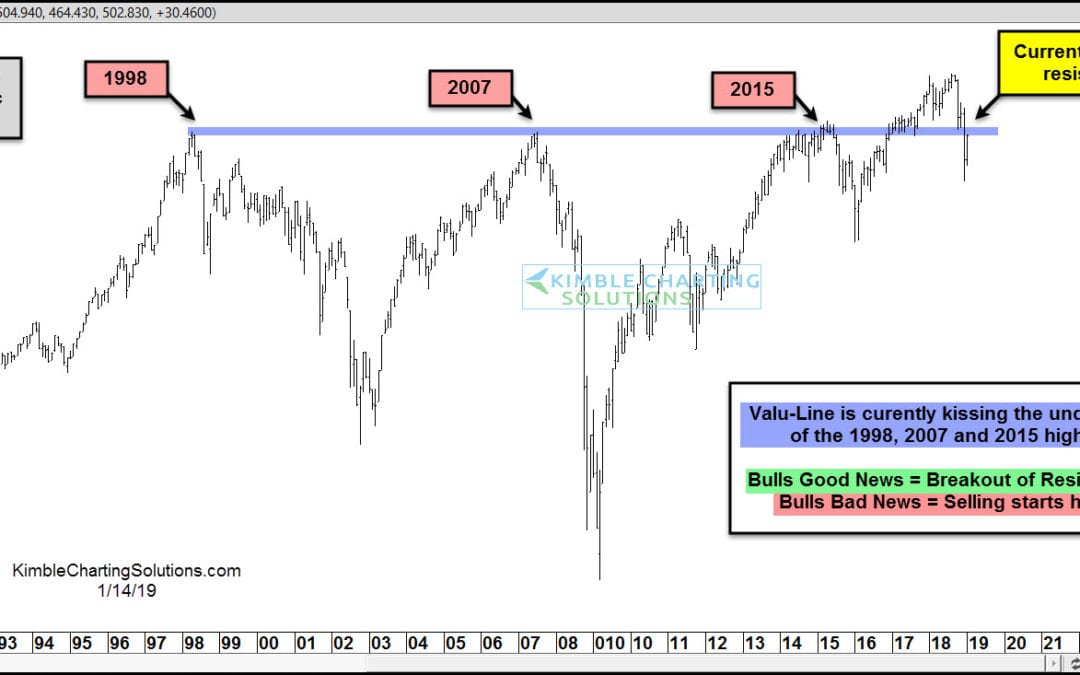
by Chris Kimble | Jan 16, 2019 | Kimble Charting
The Value Line Geometric Index tends to give investors a good idea of the health of the overall market. It is an equal-weighted index with a broad swath of stocks that gives investors an idea of how the “average stock” is performing. The Value Line Geometric formed...
