by Chris Kimble | Jan 2, 2020 | Kimble Charting
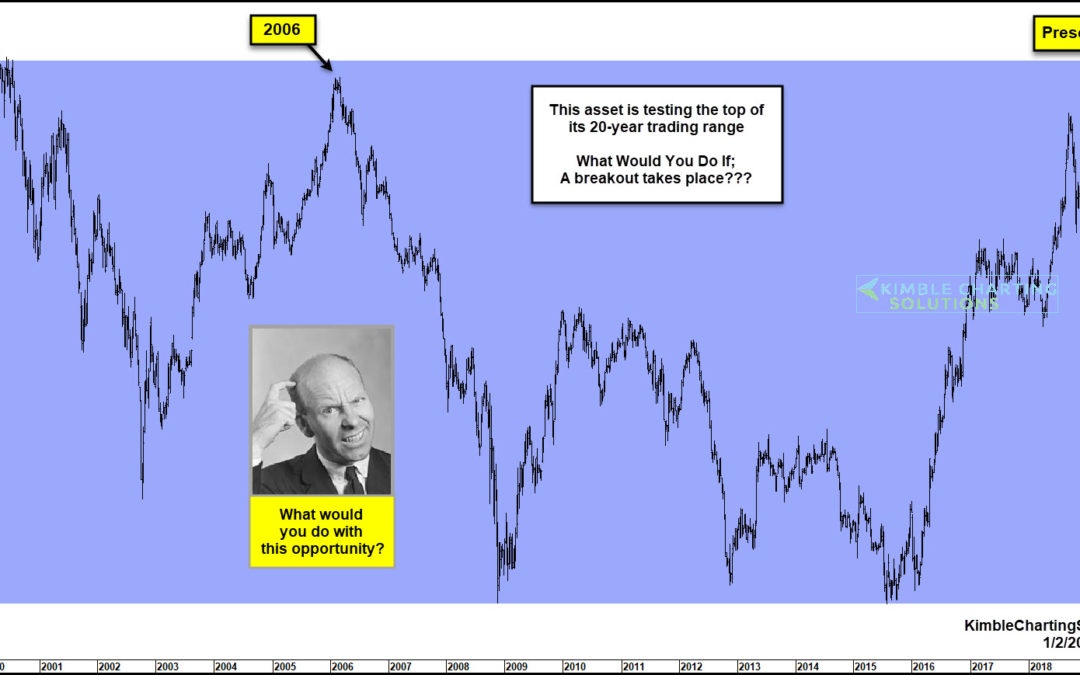
Some assets trade sideways for an extended period of time, then experience important and highly profitable breakouts? If the trading range is “20-Years” in length, would a breakout of an extended trading range become important? What about a big-time...
by Chris Kimble | Apr 6, 2018 | Kimble Charting
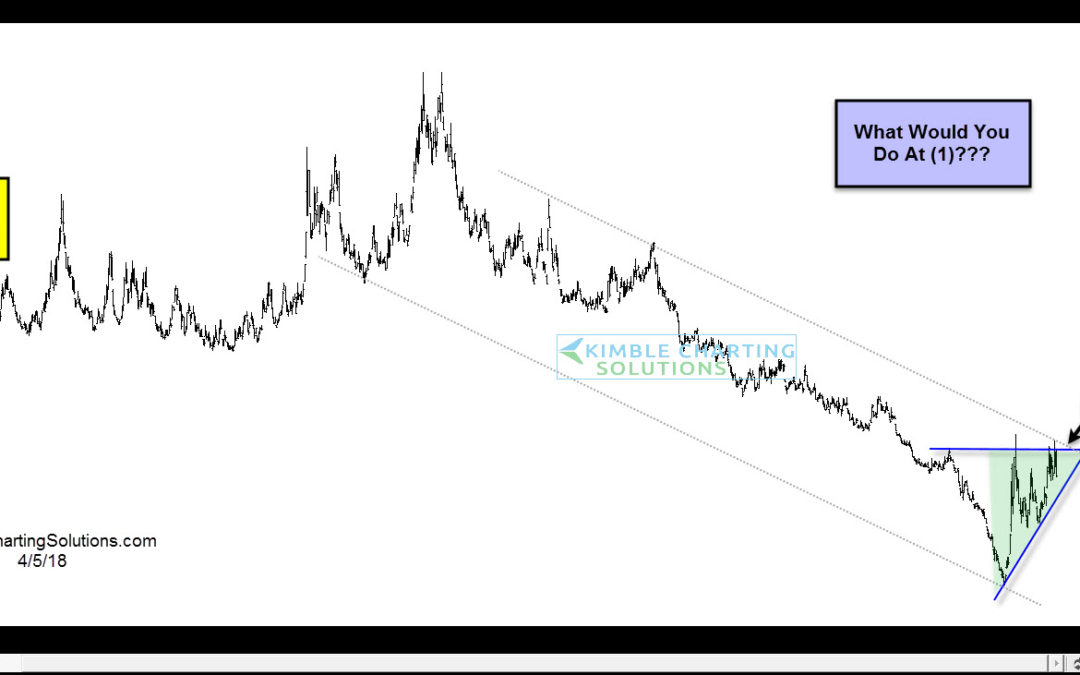
CLICK ON CHART TO ENLARGE We would like to know what you would do with the pattern/opportunity at (1). Please send all replies to [email protected] If you would like to know what this asset is, send us an email to...
by Chris Kimble | Oct 12, 2017 | Kimble Charting
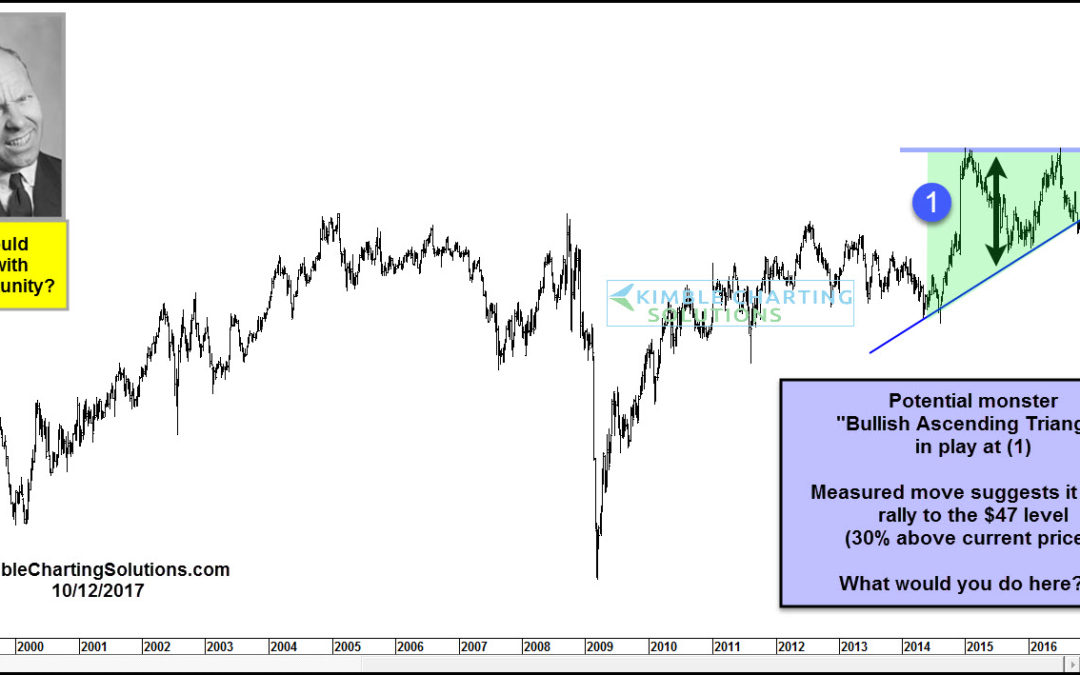
CLICK ON CHART TO ENLARGE Above looks at an asset over the past 20-years. Over the past few years, a bullish ascending triangle looks to have formed. Two-thirds of the time, this pattern breaks to the upside. If an upside breakout takes place, the measured move...
