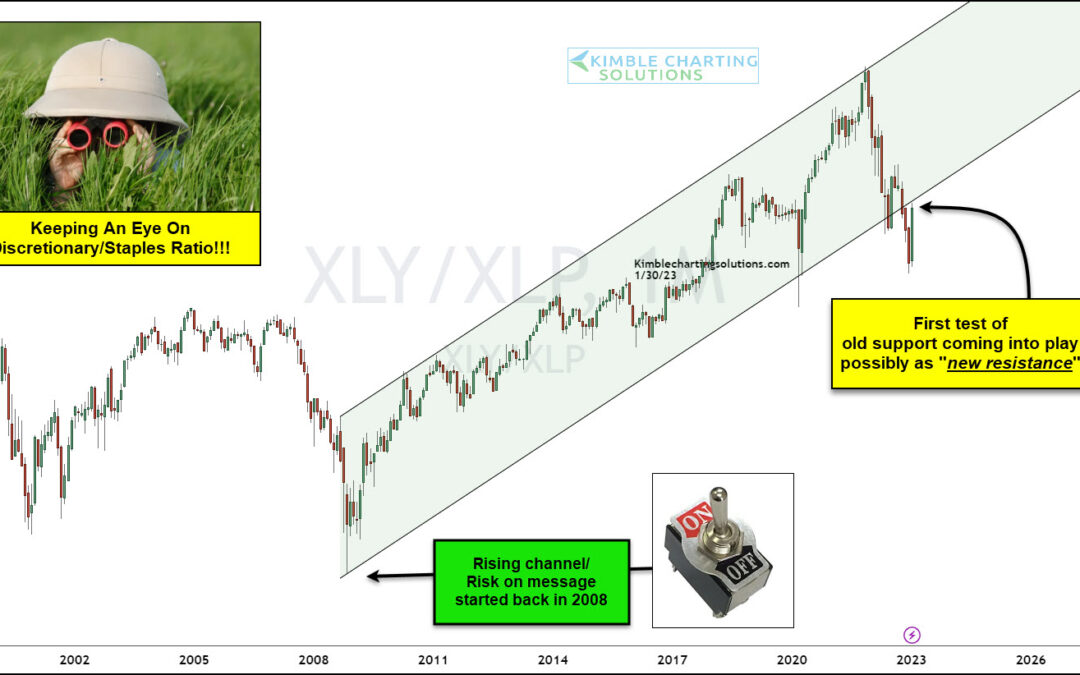
by Chris Kimble | Jan 31, 2023 | Kimble Charting
For nearly 15 years, consumer stocks moved higher in an orderly trend. But more recently, that trend has changed from bullish to uncertain. And we can see this in today’s ratio chart. Above is a ratio chart of the Consumer Discretionary ETF to Consumer Staples ETF....
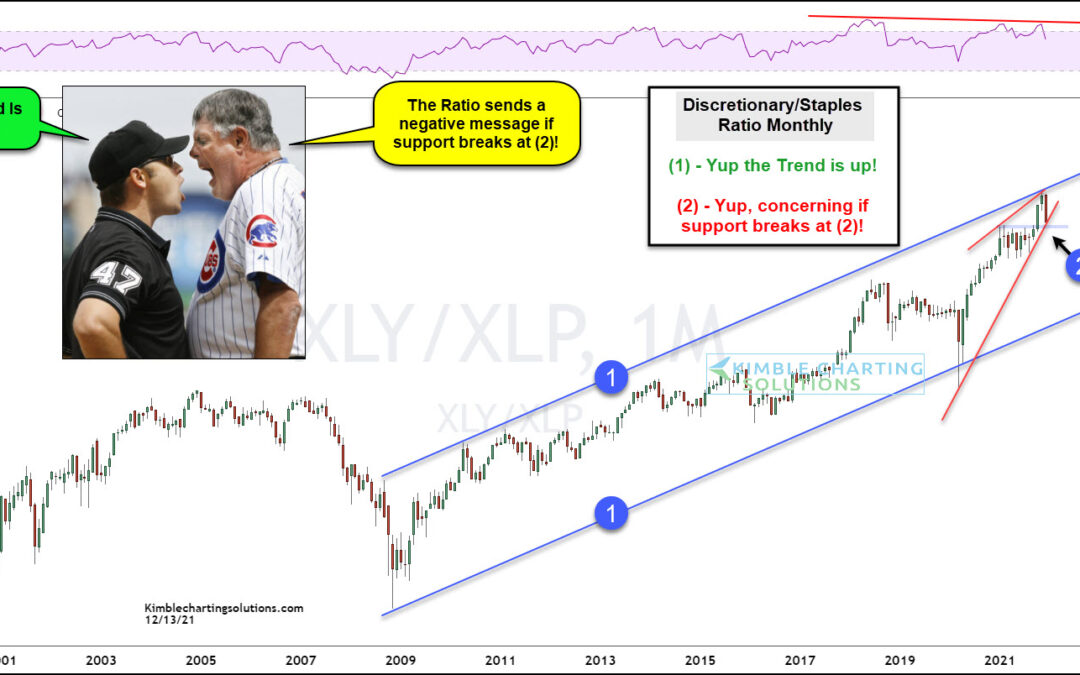
by Chris Kimble | Dec 14, 2021 | Kimble Charting
Consumer behavior can tell you a lot about the stock market. Sounds a bit funny, but it’s very true. And especially so when comparing buying of discretionary items versus buying of everyday staples items. In today’s chart, we look at the long-term performance ratio of...
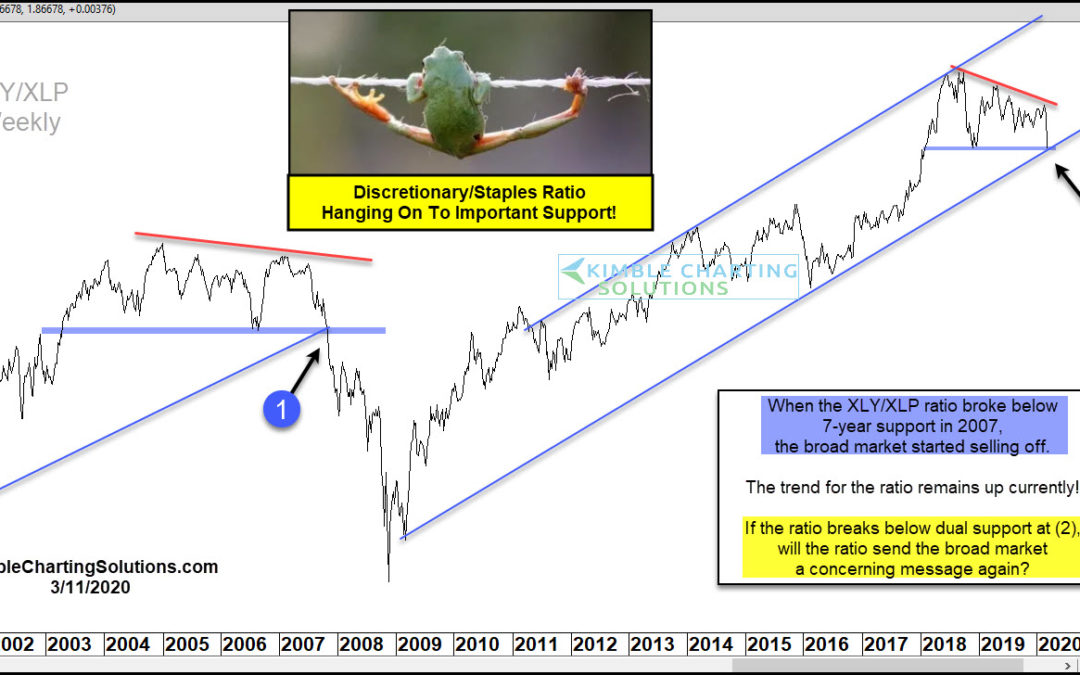
by Chris Kimble | Mar 11, 2020 | Kimble Charting
The Corona Virus seems to have people running to the stores to buy large amounts of certain staples (Toliet Paper, Paper Towels, Water). The chart looks at the Discretionary/Staples (XLY/XLP) ratio over the past 20-years. When investors started selling Discretionary...
