Who broke down first? Shanghai Index or Europe?
CLICK ON CHART TO ENLARGE
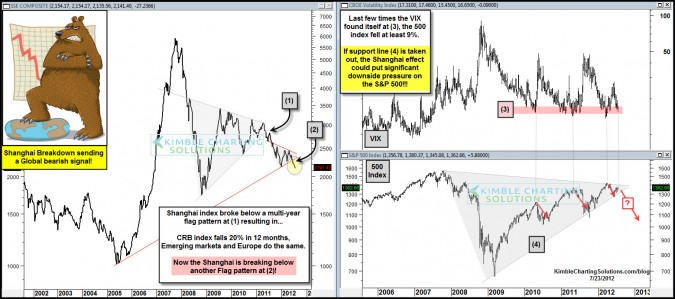
Last May the Shanghai index first broke below key support, of a multi-year flag pattern at (1) in the chart above. The Power of the Pattern suggested at that time, its “global impact could be large!” (see post here) Despite Fed intervention, Benna-Clause has not been able to keep global assets from falling in price. (see post here)
Now the Shanghai Index is breaking below the support line of another flag/pennant pattern at (2) above.
The 500 index has declined at least 9% the last three times the VIX has found itself at this price zone at (3). A break below line (4) could see the 500 do a repeat performance.
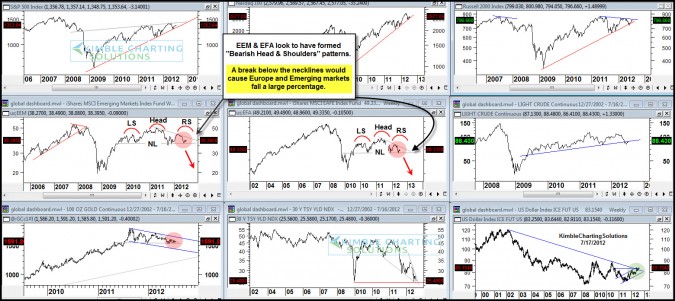
The 9-pack below represents our new “Global Dashboard” service, sent to subscribers this past week. It was reflecting that Emerging Markets (EEM) and Europe (EFA) looked to be creating Bearish Head & Shoulders patterns.
If you would like a to receive a free copy of our new “Global Dashboard” research report, please send an email to [email protected] and in the subject please enter “Free Global Dashboard Update”
CLICK ON CHART TO ENLARGE
The breaking of another support line, by the Shanghai index could well put extreme pressure on the “Head & Shoulders” pattern in the Emerging Markets, Europe and commodities.
These situations make support line (4) very important for the S&P 500!


