
 CLICK ON CHART TO ENLARGE
In the last 15 years gold is up 4X over its 2001 lows of $250 per ounce, however the last 3 years have been rough with it losing over a third of its value. Many continue to debate if Gold is in bull or bear market. Personally I am not big on labels, I care much more for being on the right side of a price trend.

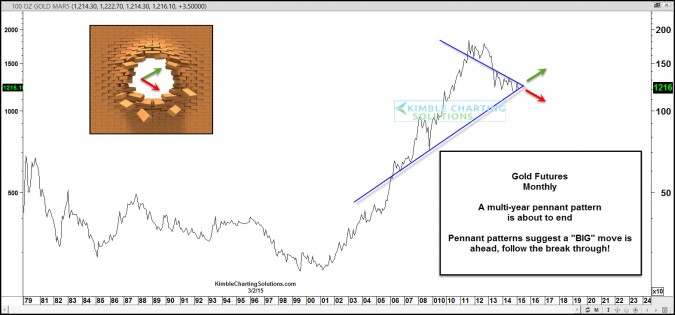
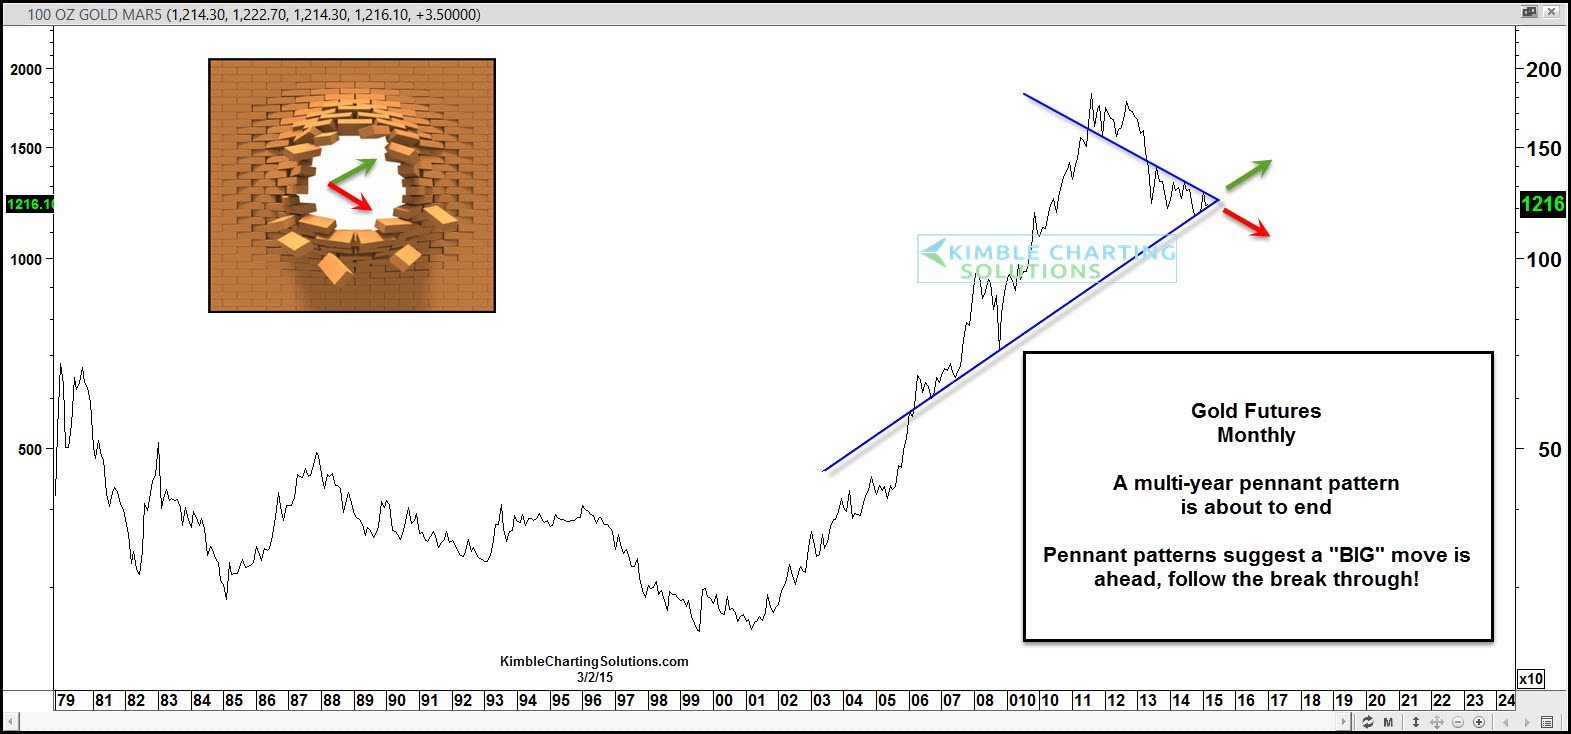
The above chart reflects that gold looks to be in pennant pattern (Lower highs & Higher lows) that is about to end pretty soon.
According to Forxetribe here are some statistics about the pennant pattern:
– In 75% of cases, the exit is made in the side of the previous trend
– In 90% of cases, this is a continuation pattern
– In 55% of cases, the target of the pattern is reached
– In 16% of cases, a pullback occur
So in 75% of the cases, the exit is made in the side of the previous trend. In your opinion, is the previous trend up or down? This question most likely could stir a heated debate on which trend Gold is in.
Full Disclosure – At this time Premium and Metals members own GDXJ due to a bullish falling wedge taking shape over the past few weeks and a breakout above the wedge being attempted. We have a game plan in place for the completion of this pennant pattern.
Bottom line to this pattern….Pennants are NOT very good at suggesting which direction a break through will take place. They are prety good at suggesting a big move will take place on the break through of support/resistance. It usually pays to follow the break through and members will!
If you would like to have daily or weekly Power of the Pattern ideas sent to your inbox, I would be honored to have you as a member

–
